Navigate sheets and bookmarks and add assets to your sheet or visualization using the assets panel.
Click Show assets in the lower left corner of a sheet to open the assets panel.
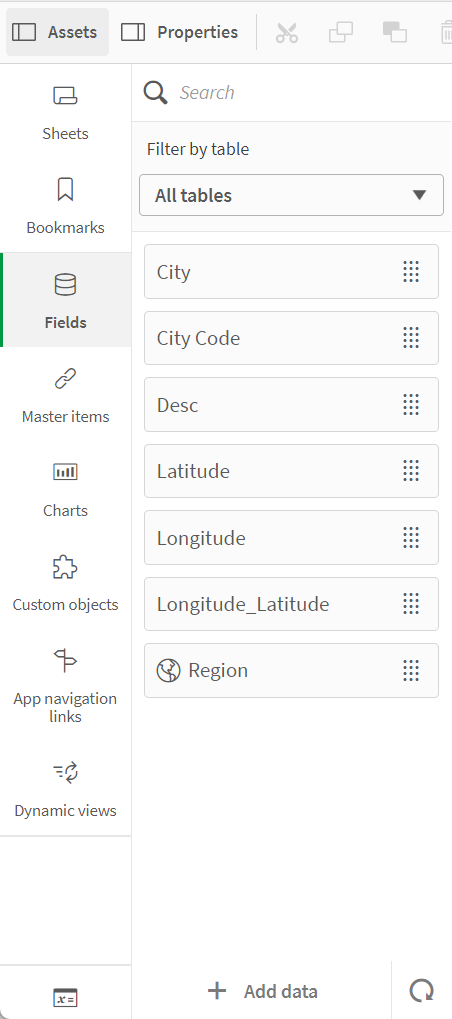
Assets panel in edit mode with Fields selected

All assets may not be available, depending on your Qlik Sense configuration.
Assets panel in edit mode
The assets panel in edit mode contains the following:
-
Sheets: View and edit sheets in the app.
-
Bookmarks: View and edit bookmarks in the app.
-
Fields: Add data to visualizations from available fields.
-
Master items: Add data to visualizations from available master items.
-
Charts: Add visualizations to the sheet.
-
Custom objects: Add custom objects to the sheet.
-
App navigation links: Add links to build on-demand apps.
-
Dynamic views: Connect a base app to a template app to use master visualizations from that app as dynamic charts in your sheets.
Fields
Fields represent the data that is available in your app. Drag a field onto a sheet to create visualizations with chart suggestions. Drag a field onto a visualization to add the field to a visualization.
Additionally, right-click on fields to do the following:
-
Create a new master dimension. See: 從欄位建立主維度
-
Create a new master measure. See: 從欄位中建立主量值
-
Create a calendar measure. See: 建立行事曆量值
-
View field settings. See: 永遠是單選值
Date and time
All date fields are marked with and can be expanded to use date and time attributes of the field. Date and time attributes are created automatically when you use the Data manager. If you used the data load script to load data, you need to create the date and time attributes using derived fields.
See: 日期與時間欄位
Map data
All fields recognized as geopoints in map visualizations are marked with .
See: 載入自己的地圖資料
Master items
Create dimensions, measures, and visualizations as master items that can be re-used in your app.
See:
Charts
Drag charts onto your sheet to create visualizations.
See: 視覺化
Custom objects
Enhance your apps with custom-designed visualizations.
See: 使用自訂物件建立視覺化
App navigation links
Build on-demand apps using app navigation links. On-demand apps load a subset of the data that is loaded in aggregate form by a selection app.
See: 建置 On-demand 應用程式
Dynamic views
Create dynamic views to query and view relevant subsets of large data sets in charts that can be dynamically refreshed as selections are made.
See: 透過動態檢視管理資料
Variables
Click to open the variables dialog.
See: 變數對話方塊
Search
使用搜尋欄位尋找資產。在搜尋欄位中輸入時,即會顯示名稱或標記中包含該搜尋字串的項目。
See: 在資產面板中搜尋
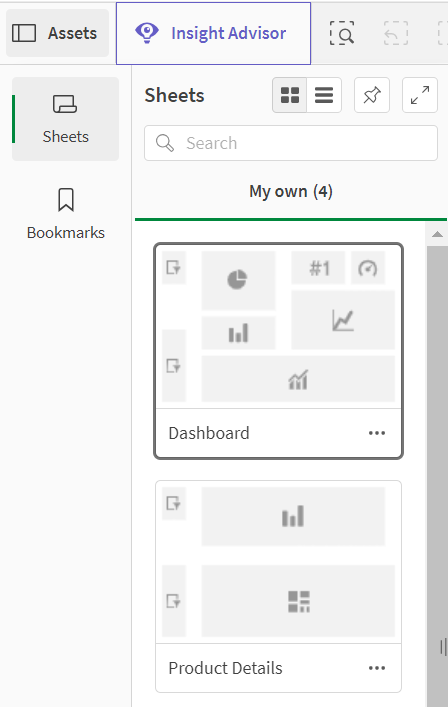
Assets panel in analysis mode
In analysis mode, click Assets to open a panel where you can create and manage the following:
-
Sheets: View and navigate sheets in the app. Create and group sheets.
-
Bookmarks: View and navigate bookmarks in the app. Create new bookmarks.
To pin the assets panel open in analysis mode, click . The assets panel can be resized by clicking and dragging the border of the assets panel.
You can make Sheets or Bookmarks full screen by clicking .
You can view Sheets as a grid or list. Sheets can also be grouped together. For more information, see 分組工作表.
Assets panel in analysis mode

