A database connection is created in the Profiling perspective.
About this task
In the example below, you want to create time correlation analysis to compute the
minimal and maximal birth dates for each listed country in the selected nominal column. Two
columns are used for the analysis: birth date and country.
Information noteRestriction: The time
correlation analysis is possible only on database columns. You can not use this analysis
on file connections.
Defining the time correlation analysis
Big Data Platform
Cloud API Services Platform
Cloud Big Data Platform
Cloud Data Fabric
Cloud Data Management Platform
Data Fabric
Data Management Platform
Data Services Platform
Qlik Talend Cloud Enterprise Edition
Qlik Talend Cloud Premium Edition
Real-Time Big Data Platform
Procedure
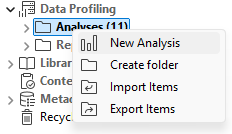
In the DQ repository
tree view, expand Data Profiling and right-click Analyses > New analysis.
The Create new analysis
wizard opens.
Select Correlation > Time Correlation Analysis and click Create.
In the Name field, enter a name for the
current analysis.
Information noteImportant:
Do not use the following special characters in the item names: ~ ! ` # ^ * & \\ / ? : ; \ , . ( ) ¥ ' " « » <
>
These characters are all replaced with "_" in the file system and you may end up
creating duplicate items.
Set the analysis metadata (Purpose,
Description and Author) in the
corresponding fields and then click Finish.
A node for the newly created analysis is listed under
Analyses in the DQ repository
tree view, and the analysis editor opens on the analysis metadata.
Selecting the columns for the time correlation analysis and setting analysis parameters
Big Data Platform
Cloud API Services Platform
Cloud Big Data Platform
Cloud Data Fabric
Cloud Data Management Platform
Data Fabric
Data Management Platform
Data Services Platform
Qlik Talend Cloud Enterprise Edition
Qlik Talend Cloud Premium Edition
Real-Time Big Data Platform
Procedure
From the Connection menu, select the database connection
on which to run the analysis.
The time correlation analysis is possible only on database columns for the time
being. You can change your database connection by selecting another connection
from the Connection list. If the analyzed columns do not
exist in the new database connection you want to set, you receive a warning
message that enables you to continue or cancel the operation.
From the Connection menu, select the database connection
on which to run the analysis.
From the Columns menu, click
Select columns.
If you right-click any of the listed columns and select Show in DQ
repository view, the selected column will be automatically located
under the corresponding connection in the tree view.
Browse the catalogs/schemas in your database connection to the columns you want
to analyze.
You can filter the table or column lists by typing the desired text in the
Table filter or Column filter
fields respectively. The lists will show only the tables/columns that correspond
to the text you type in.
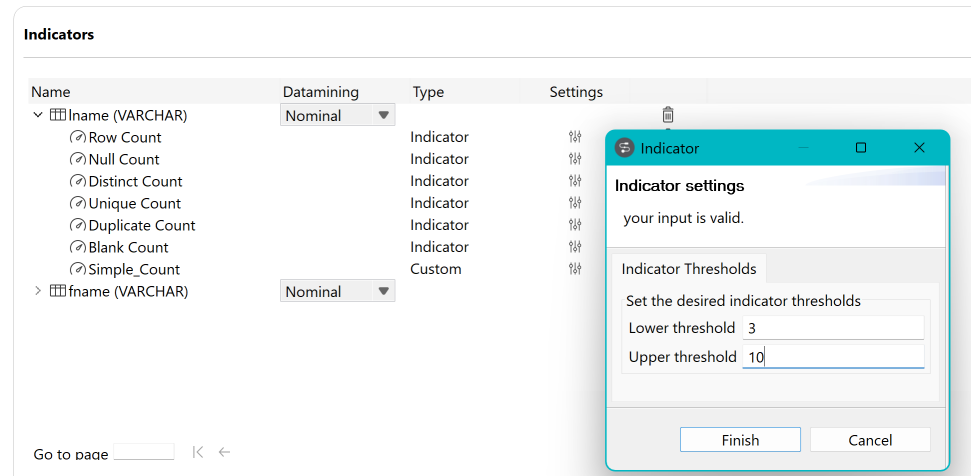
If needed, set thresholds for some indicators by clicking .
The indicators representing the simple statistics are by-default attached to
this type of analysis.
From the Advanced settings menu, set a Number
of connections per analysis.
You can set this number according to the database available resources, that is
the number of concurrent connections each database can support.
If you want to use context variables, click Open context
view.
Setting context variables allows to filter data and to decide the number of
concurrent connections per analysis respectively.

 .
.
 The indicators representing the simple statistics are by-default attached to this type of analysis.
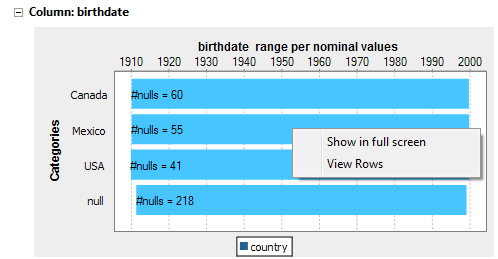 For detail explanation of the analysis results, see Exploring the results of the time correlation analysis.