From Talend Studio, you can create an
analysis that compares two identical sets of columns in two different tables. This
redundancy analysis supports only database tables.
Before you begin
At least one database connection is set in the Profiling perspective. For further information, see Connecting to a database.
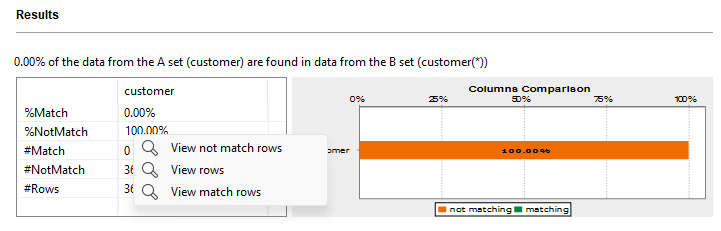
Through this view, you can also access the actual analyzed data via the Data
Explorer.
To access the analyzed data rows, right-click any of the lines in the table and select
an action to perform:
View match rows: access a list of all rows that could be
matched in the two identical column sets.
View not match rows: access a list of all rows that could
not be matched in the two identical column sets.
View rows: access a list of all rows in the two identical
column sets.
Information noteWarning: The data explorer does not support connections that have an empty
username, such as Single sign-on of MS SQL Server. If you analyze data using such
connection and you try to view data rows in the Data Explorer perspective, a warning message prompt you to set your connection credentials
to the SQL Server.
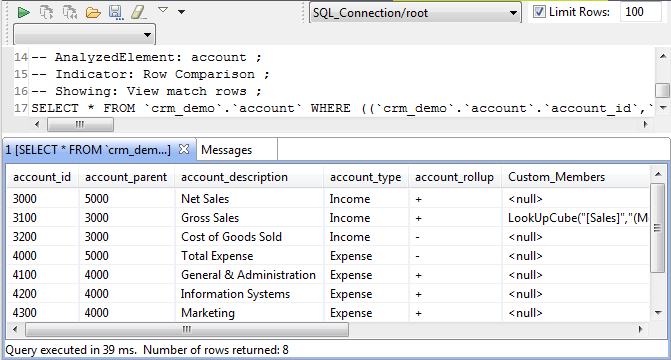
The figure below illustrates the data explorer list of all rows that could be matched in
the two sets, eight in this example.
From the SQL editor, you can save the executed query and list it under the Libraries > Source Files folders in the DQ repository tree view if you click the save icon on the editor toolbar. For more
information, see Saving the queries executed on indicators.
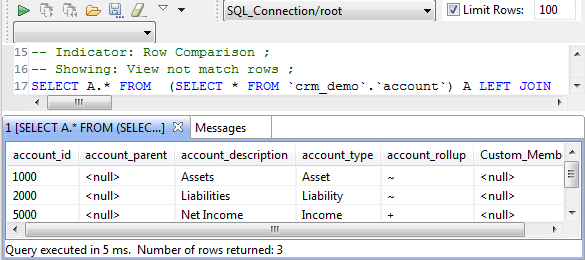
The figure below illustrates the data explorer list of all rows that could not be matched
in the two sets, three in this example.
Defining the redundancy analysis
Big Data Platform
Cloud API Services Platform
Cloud Big Data Platform
Cloud Data Fabric
Cloud Data Management Platform
Data Fabric
Data Management Platform
Data Services Platform
Qlik Talend Cloud Enterprise Edition
Qlik Talend Cloud Premium Edition
Real-Time Big Data Platform
Procedure
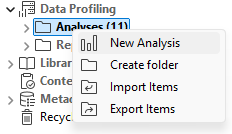
In the DQ repository
tree view, expand Data Profiling and right-click Analyses > New analysis.
The Create new analysis
wizard opens.
Select Table > Redundancy Analysis and click Create.
In the Name field, enter a name for the current
analysis.
Information noteImportant:
Do not use the following special characters in the item names: ~ ! ` # ^ * & \\ / ? : ; \ , . ( ) ¥ ' " « » <
>
These characters are all replaced with "_" in the file system and you may end up
creating duplicate items.
Set the analysis metadata (purpose, and description) in the corresponding fields
and click Next.
Selecting the identical columns you want to compare
Big Data Platform
Cloud API Services Platform
Cloud Big Data Platform
Cloud Data Fabric
Cloud Data Management Platform
Data Fabric
Data Management Platform
Data Services Platform
Qlik Talend Cloud Enterprise Edition
Qlik Talend Cloud Premium Edition
Real-Time Big Data Platform
Procedure
From the Connection
menu, select the connection and click Next.
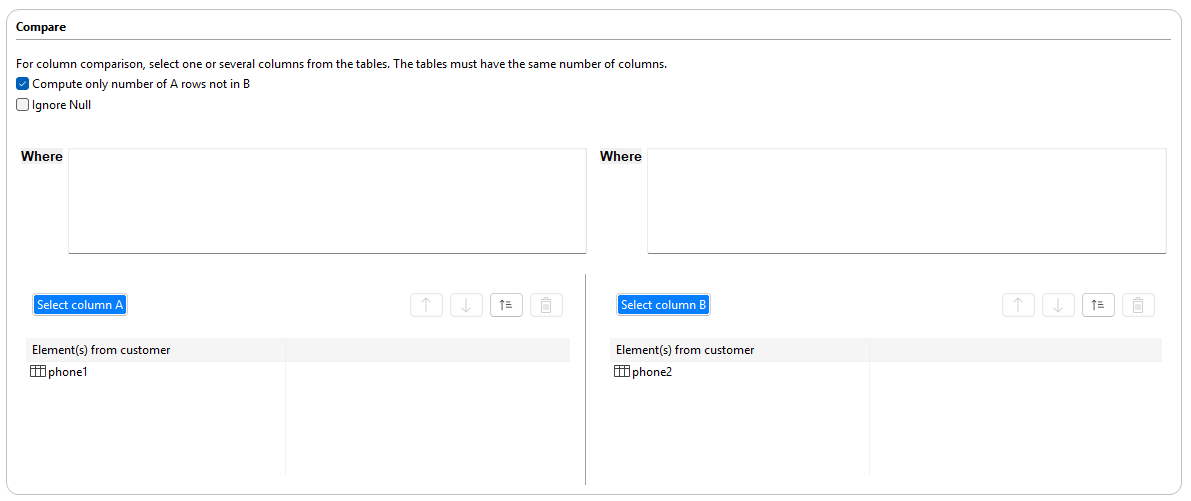
From the Compare menu,
select the columns to compare.
In this example, you want to compare identical columns in the
phone1 and phone2 tables.
Click Select column A to open the
Column selection dialog box.
Browse the catalogs/schemas in your database
connection to reach the table holding the columns you want to analyze.
You can filter the table or column lists by
typing the desired text in the Table filter or
Column filter fields respectively. The lists will
show only the tables/columns that correspond to the text you type in.
Click the table name to list all its columns in the
right-hand panel of the Column selection dialog
box.
In the list to the right, select the check boxes of the columns you want to
analyze and click OK to proceed to the next step.
You can drag the columns to be analyzed directly from the DQ repository tree view to the editor.
If you right-click any of the listed columns in the Analyzed
Columns view and select Show in DQ repository
view, the selected column will be automatically located under
the corresponding connection in the tree view.
Click Select column B and follow
the same steps to select the second set of columns or drag it to the right
column panel.
To match the data from the A set against the data from the B set and not vice
versa, select the Compute only number of A rows not in B
check box.
Select the Ignore null check box if you want to ignore
the NULL values when matching.
If needed, enter an SQL WHERE clause to filter the data on which to run the
analysis.
Finalizing and executing the analysis
Big Data Platform
Cloud API Services Platform
Cloud Big Data Platform
Cloud Data Fabric
Cloud Data Management Platform
Data Fabric
Data Management Platform
Data Services Platform
Qlik Talend Cloud Enterprise Edition
Qlik Talend Cloud Premium Edition
Real-Time Big Data Platform
About this task
You can set some advanced settings such as the number of connections per analysis
and the context.
Procedure
From the Settings menu,
set the number of concurrent connections allowed per analysis in the
Number of connections per analysis field.
You can set this number according to the
database available resources, that is the number of concurrent connections each
database can support.
To use contexts, click Open context
view.
The
Context view opens and you can manage the contexts.
For further information about contexts and variables, see Using context variables in analyses.
Click Save and Run. A confirmation message is
displayed.
Information noteTip: If you only want to save the configuration, click in top-right corner.
Click OK if you want to continue the operation.
Results
The Analysis results view opens showing the analysis results.
In this example, 0% of the data present in the columns in the
phone1 table match with the same data in the columns in
the phone2 table. There are no duplicates.
Did this page help you?
If you find any issues with this page or its content – a typo, a missing step, or a technical error – please let us know!

 in top-right corner.