Skip to main content Skip to complementary content

Using filters to create "if" conditions on customer data

The video_customers.xlsx dataset contains a sample with several information about the US customers of a video streaming company. Names, states, ages and subscription dates, among others, are listed in this file.

After combining different filters that work like "if" conditions, you will be able to perform cleansing operation on the customers category that you want to target specifically. In this example you want to output a file listing the customers in the 30-55 age range and from the five US states with the most registered customers, while getting rid of unusable data.

Download the file: video_customers.xlsx.

Adding a preparation for the video customers dataset

Add a preparation to start preparing and cleansing your data.

You can create a preparation from a dataset already available in Talend Data Preparation or one of your local files. When you add a preparation with the corresponding button, it will be created in the folder in which you are currently working. Furthermore, your preparation will be automatically saved in the preparations list, and all the changes you make are also saved automatically.

Before you begin

You have created the video_customers dataset in Talend Cloud Data Preparation using the previously downloaded file.

Procedure

  1. From the homepage, click Preparations to open the list of preparations.
  2. Click the Add Preparation button.
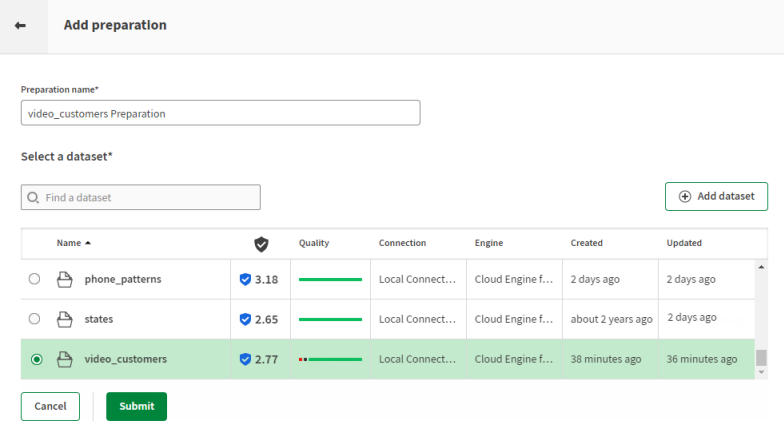
  3. From the list of Datasets, select video_customers to use it as source material.
    Add a preparation window with a list of datasets available to create a preparation, including video_customers.
    The Preparation name field is automatically filled in but you can change the preparation name.
  4. Click Submit.

Results

Your dataset opens with an empty recipe, and you can start adding preparation steps. All your changes are automatically saved.

Removing empty and invalid records

The quality bar indicates that a column contains empty or invalid records.

Some columns in the grid with their quality bar showing invalid or empty cells.

In the quality bar, data that matches the column type is shown in green, while red shows invalid data that does not match the column type. Empty records are shown in grey.

Because you want to focus on customers from a specific age range and specific states, empty data in the corresponding columns would be useless for you. You are simply going to remove the rows with empty data in the age and state columns, as well as removing invalid values from the dataset.

Procedure

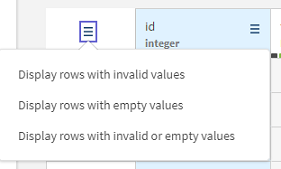
  1. Click the white menu icon on the top left of the grid and select Display rows with invalid or empty values.
    Filtering options for the empty and invalid rows in the whole dataset.

    You can see that this action creates a filter on your data, and only the rows with empty or invalid entries from the dataset are now displayed. All the filters that are applied on your data at any moment can be seen on top of the grid.

    In addition, you can see that a new option is available at the bottom of the functions panel. Indeed, when any filter, or condition, is applied, you have the choice to apply functions on the full data, or the filtered data only. This is Talend Cloud Data Preparation's way of working with conditions.

    Now that this first filter is active on your whole data, you are going to specifically remove empty records from the age and state columns.

  2. Click the grey part of the quality bar in the header of the age column.
  3. From the menu that opens, select Delete the rows with empty cell.

    Now that the empty values have been removed, the age column only contains valid data, as you can see in the quality bar for this column.

  4. Repeat the same operation for the state column.

    As revealed by the condition currently active, other columns in your dataset contain empty values, but since the focus is on the age and location, we can leave them as is. On the other hand, you will remove the invalid data from the phone number column, that can be used for marketing purposes.

  5. Click the red part of the quality bar of the phone number and select Delete the rows with invalid cell.

    All the data that was considered invalid has now been removed.

  6. Click the bin icon in the filter bar to clear the filter and display the whole dataset again.

Results

The rows with empty or invalid values for the age, state and phone numbers columns have been removed. Now that the dataset is a bit cleaner, you can start focusing on the data you want to put in light.

Creating filters on the ages and states

Creating a filter is a quick way to identify or isolate data.

You will once again use filters to isolate the data that is of the most interest to you in this example, namely the age and location of your customers. The data profiling area on the bottom right of the interface allows you to interact with the charts illustrating the data of the age and state columns, and select a specific range of data.

Procedure

  1. Click the header of the age column to select its content.

    In the data profiling area, on the bottom right of the screen, you can see a vertical bar chart, displaying the number of occurrences of each value listed in the column.

    Bar chart showing the repartition of values in the age column.

    You can see here that the minimum age that can be found is 18, and the maximum value is 80.

  2. To limit the age values displayed on the grid and create a filter on the 30-55 range, you can either:
    • Drag both ends of the range slider to select the minimum and maximum values to be displayed.
      Bar chart showing the repartition of values in the age column, filtered between 30 and 55.
    • Enter 30 as minimum value and 55 as maximum directly in the dedicated fields.

    You can see that a new filter was applied on the dataset, and customers data is only displayed if it matches the condition set on the 30-55 age range.

    A filter is applied to only show the age values between 30 and 55.

    Filters can be created by manually entering values in the filter bar text area, but diagrams are a convenient and quick way to apply filters on your data, for one or several columns at a time.

    Now that you have vision on a specific age range, you will add a second filter on top of the previous one. Filters can be combined in many ways. Here you will choose to display the five state with the highest number of customers.

  3. Click the header of the state column to select its content.

    This time, the data is displayed as an horizontal bar chart in the profiling area.

    Bar chart showing the repartition of values for the state column.
  4. To create a filter on the top five states, those with the most customers, keep the Shift key pressed and click California, Texas, Florida, New York and Virginia.
    Bar chart showing the repartition of values for the state column, filtered on 5 states.

    As you can see in the filter bar, the filter is applied on top of the first one, and only the data that corresponds to both is displayed on the grid.

    Two filters are applied to only show some values of the age and state columns.
  5. To remove the data that is not used anymore and only keep this sample, click the Keep these filtered rows function from the functions panel.

    This function is only available if the Apply changes to: Filtered rows radio button is activated.

  6. Click the bin icon or click the cross in each individual filter to clear the filter bar.

Results

Your sample now only displays a restricted list of customers, that match the conditions you had fixed.

Exporting the data for a specific customer range

Now that the data that you wanted to focus on has been isolated and cleansed, you can export it as a local file.

Through the use of filters, you have performed conditioned actions on your data. Only the data applying to customers ranging from 35 to 50 in certain states have been kept. The prepared dataset is now ready to be exported.

Procedure

  1. Click the Export button.
  2. Choose the file format you want to use when exporting your data:
    • If you choose Local CSV file, select which field delimiter, text enclosure and escape characters to use and enter a name for the file to export.
    • If you choose Local XLSX file, choose a name for the file to export.
    • If you choose Amazon S3, enter your credentials and other information to store your file on Amazon S3.

Results

The data you cleansed using your preparation is exported to a local file.

Did this page help you?

If you find any issues with this page or its content – a typo, a missing step, or a technical error – please let us know!