
In most visualizations, dimensions and measures are essential parts. The dimensions and measures define what the visualizations display, and by adding more than one dimension or measure you can compare or group data in different ways.
It is also possible to add alternative dimensions and measures through the property panel while editing the visualization. Alternative dimensions and measures are dimensions and measures that are available, but not currently used in the visualization. After a dimension or measure has been added as alternative, they can easily be accessed and used through the visual exploration menu during analysis.
Adding dimensions
In the properties panel, under Data, you can add a dimension. In the Dimensions section, click Add to add a dimension, or Add alternative to add an alternative dimension. This opens a list of available Dimensions and Fields. The dimensions are those that exist as master items and the fields are those that have been loaded into the app.
For example, if you create a dimension by clicking Add and typing Month. You select the field Month from the list to create a new dimension. You can edit the dimension after it has been created.
Adding measures
In the properties panel, under Data, you can add a measure. In the Measures section, click Add to add a measure, or Add alternative to add an alternative measure. This opens a list of available Measures (if any).
Let us assume that you create a measure by clicking Add and typing Sum(Sales) to create a new measure that calculates the sum of sales. You can edit the measure after it has been created.
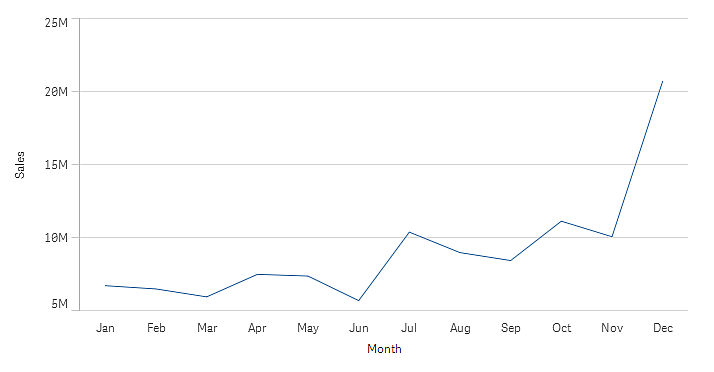
In the following line chart, a measure Sales and a dimension Month have been added.
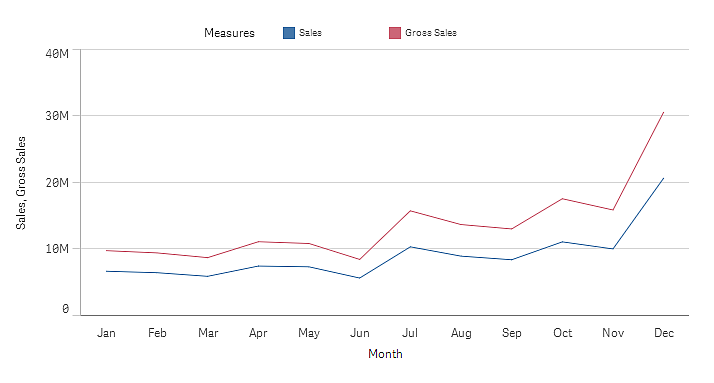
You can add a second measure, Gross Sales, to compare with Sales.
Many visualizations have limitations on how many dimensions and measures that can be displayed at the same time. A line chart with two or more measures can only have one dimension, and a line chart with two dimensions can only have one measure. However, even if there are limitations on a visualization, you may sometimes have more dimensions or measures than those that are used in the visualization. This can happen when you have converted from one visualization to another, and some of the dimensions and measures are not used in the new visualization, or if you have added alternative dimensions and measures in the properties panel. The unused dimensions and measures are not displayed in the visualization, but they are visible in the properties panel under Dimensions and Measures, respectively.
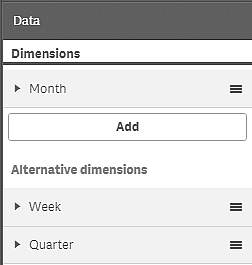
In the following screenshot from the properties panel, there are three dimensions: Month, Week, and Quarter. The screenshot shows that the dimension Month is in use. If the visualization supports additional dimensions to be used, you can drag alternative dimensions from the Alternative dimensions section to the Dimensions section.
Master items
Dimensions and measures that are linked to a master item are displayed with a é in the properties panel. If you want to edit a linked dimension or measure, you have two options: either updating the master item in the assets panel, or unlinking the item and making the changes in the properties panel. An update of the master item is reflected in all linked items.
Even if linked items cannot be edited in the properties panel, you still have a few settings that can be edited. These are related to the presentation of the items.
A visualization that is linked to a master item is displayed with a é on the sheet. You can edit a linked visualization, either by editing the master item or by unlinking the visualization. The unlinked visualization is independent of the master item and can be edited, but it can still contain dimensions or measures that are linked to master items.
Editing a dimension
You can edit dimensions in the properties panel. If you want to edit a master item, you must first unlink the dimension from the master item. In the properties panel, click the dimension that you want to edit.
Field: Start typing the field name to display a list of matching fields to choose from. You can also click 3 to open the expression editor, where you can create a calculated dimension.
Label: Enter a name for the dimension.
Include null values: When this is checked, the visualization will include the null values of the dimension, presented as a gap or a dash, depending on the type of visualization. For example, if you have sales figures but do not have any information about what company the figures belong to, the figures will be added to the measure value for the null value dimension.
Limitation: You can limit the number of dimension values that are displayed.
Show others: When you have set a limitation for the number of dimension values displayed, you have an option to summarize the measure values for the remaining dimensions by selecting Show others.
Editing a measure
You can edit measures in the properties panel. If you want to edit a master item, you must first unlink the measure from the master item. In the properties panel, click the measure that you want to edit.
Expression: Enter the expression. You can also click 3 to open and use the expression editor.
Label: Enter a name for the measure. The label is not automatically updated when you make changes in Expression.
Number formatting: Set the number formatting for the measure values. The options Number and Date offer custom formatting options for defining your own format pattern.
Invalid dimensions and measures
Dimensions and measures are invalid when the associated expression cannot be interpreted by Qlik Sense.
If you create an invalid dimension or edit an existing one so that it becomes invalid, the dimension is presented in the properties panel as dimmed with a red hue and the text Invalid dimension to indicate that the dimension is invalid. If you use an invalid dimension in a visualization, the visualization cannot be displayed.
If you create an invalid measure or edit an existing one so that it becomes invalid, the Expression text box under Measures in the properties panel is presented with a red border to indicate that the measure is invalid.
Deleting dimensions and measures
In the properties panel, you can delete a dimension or measure. Long-touch or right-click the dimension or measure and select Delete in the dialog. Alternatively, click the dimension or measure and click DeleteÖ. If you delete an instance of a master item, the master item is still available in the assets panel.