
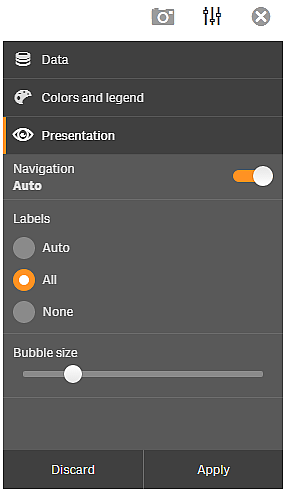
You can change some visualization properties to further analyze the data without making selections or editing the sheet, by using the visual exploration menu. For example, you can change data, sort data, color by dimension or measure, and change how labels are displayed.
Do the following:
- When analyzing, hover over the visualization you want to change.
- Click Ú at the top right of the visualization or right-click on the visualization and select Open exploration menu.
- Update the properties you want to change.
-
To close the menu and save your changes, click Ú at the top right of the visualization. The changes are saved during this session.
To save your changes for future sessions (and have them updated in the properties panel), click Apply. This button is only available for unpublished sheets, visualizations that are not master items or linked to master items, and for users with rights to edit the sheet.
Information noteIf you do not click Apply to save the changes or Discard to discard the changes and later click Edit to edit the sheet, you will be prompted to select whether to apply or discard the changes you made when analyzing the sheet.
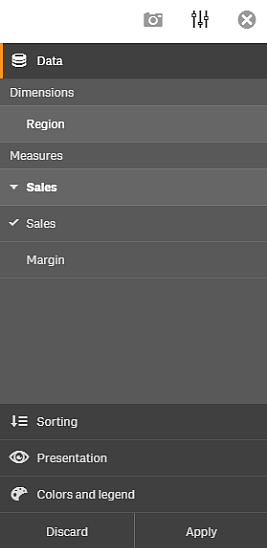
Changing the data using the visual exploration menu
When you have alternative dimensions or measures for a visualization, you can use the visual exploration menu to change the data that is used in the visualization. To switch to another dimension or measure, click on the dimension or measure you want the visualization to display. The selection is marked with a m.
On a small screen
When you are using Qlik Sense on a very small screen (640 pixels wide or smaller), you access the visual exploration menu by doing the following:
- Tap the visualization you want to change to open it in full screen.
- Tap Ú at the top of the visualization or long-touch on the visualization and select Open exploration menu.
- Update the properties you want to change.
- To get a preview of what the changes will look like, long-touch outside of the menu on the visualization, and the menu will slide to the side. Release to open the menu again and continue doing your changes.
- To close the menu and save your changes, tap Ú at the top of the visualization, or long-touch and select Close exploration menu.