
The Effects library contains a list of different visual effects to apply to your snapshots. You apply an effect to a snapshot by dragging one of the effects onto a snapshot.
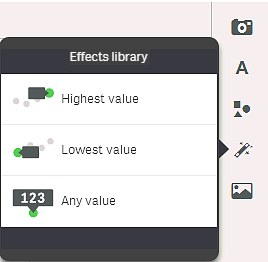
| Highest value |
For visualizations with a single dimension and measure, this effect will make the highest value stand out by adding a label to the highest value and dimming the other values. For visualizations with grouped values, the highest value in each group will be highlighted. |
| Lowest value |
For visualizations with a single dimension and measure, this effect will make the lowest value stand out by adding a label to the lowest value and dimming the other values. For visualizations with grouped values, the lowest value in each group will be highlighted. |
| Any value |
For visualizations with a single dimension and measure, this effect will make a value, that you select manually, stand out by adding a label to the selected value and dimming the other values. For visualizations with grouped values, you choose to highlight either a measure or a dimension. The selected measure or dimension will be highlighted in all the groups where it occur. |