ValueList() returns a set of listed values, which, when used in a calculated dimension, will form a synthetic dimension.
Syntax:
ValueList(v1 {,...})
Return data type: dual
Arguments:
| Argument | Description |
|---|---|
| v1 | Static value (usually a string, but can be a number). |
| {,...} | Optional list of static values. |
Examples and results:
| Example | Result |
|---|---|
| ValueList('Number of Orders', 'Average Order Size', 'Total Amount') |
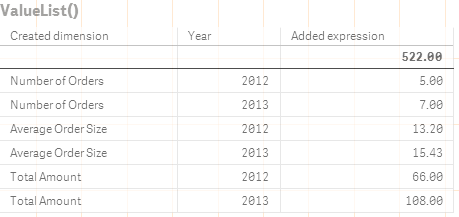
When used to create a dimension in a table, for example, this results in the three string values as row labels in the table. These can then be referenced in an expression. |
|
=IF( ValueList('Number of Orders', 'Average Order Size', 'Total Amount') = 'Number of Orders', count(SaleID), IF( ValueList('Number of Orders', 'Average Order Size', 'Total Amount') = 'Average Order Size', avg(Amount), sum(Amount) )) |
This expression takes the values from the created dimension and references them in a nested IF statement as input to three aggregation functions:
|
Data used in examples:
SalesPeople:
LOAD * INLINE [
SaleID|SalesPerson|Amount|Year
1|1|12|2013
2|1|23|2013
3|1|17|2013
4|2|9|2013
5|2|14|2013
6|2|29|2013
7|2|4|2013
8|1|15|2012
9|1|16|2012
10|2|11|2012
11|2|17|2012
12|2|7|2012
] (delimiter is '|');

