You draw your selections, either on the y-axis or the x-axis. For an axis showing measure values, you are also able to click on the range bubble to enter a specific numeric value.
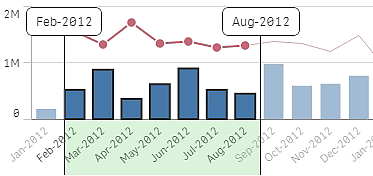
Bar chart example
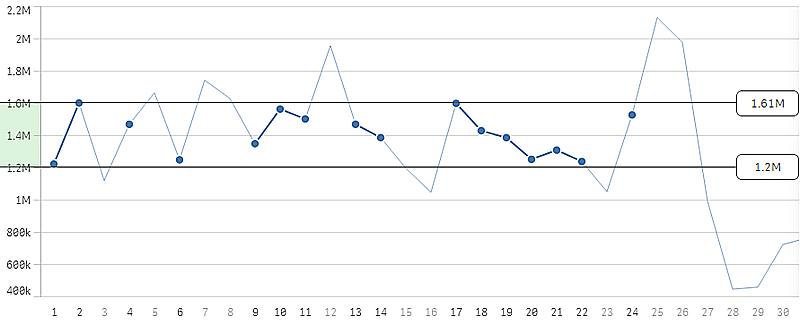
Line chart example
Did this page help you?
If you find any issues with this page or its content – a typo, a missing step, or a technical error – please let us know!