
The pie chart displays the relation between values as well as the relation of a single value to the total. You can use a pie chart when you have a single data series with only positive values.
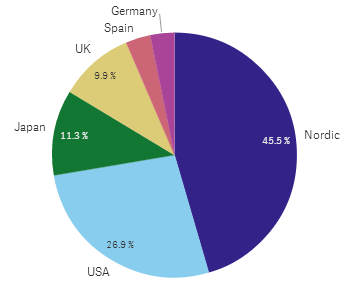
Sales per region in a pie chart
Default settings for a pie chart
The following settings are used by default in a pie chart:
- The top 10 sectors are presented in descending size order, clockwise.
- Colors are presented by dimension.
- Value labels are presented in percent.
All these settings can be changed in the properties panel.
Number of dimensions and measures
A pie chart is built from one dimension and one measure only.