
In the data model viewer, you can get a preview of any data table in a panel at the bottom of the screen. In the preview, you can quickly inspect the contents of a table or field. You can also add dimensions and measures quickly if you select a field.
Additionally, meta data for the selected table or field are displayed in the preview panel.
You can show and hide the preview panel in two ways:
- Click in the data model viewer toolbar
- Click the Preview header
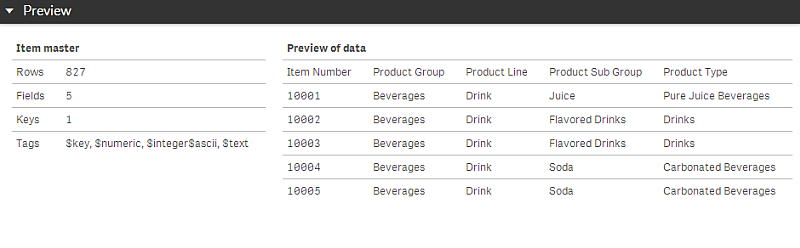
Showing a preview of a table
Do the following:
- Click a table header in the data model viewer.
The preview panel is displayed with fields and values of the selected table.
Showing a preview of a field
Do the following:
- Click a table field in the data model viewer.
The preview panel is displayed with the selected field and its values, and meta data for the field. You can also add the field as a master dimension or measure.
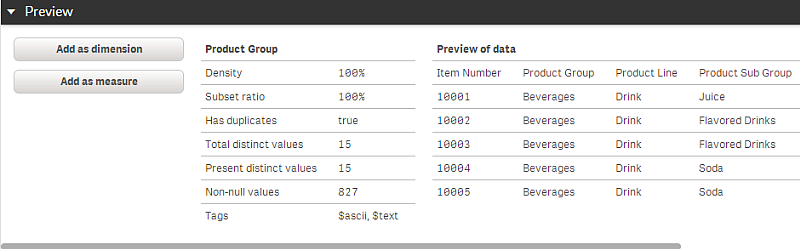
- Density is the number of records that have non-NULL values in this field, as compared to the total number of records in the table.
- Subset ratio is the number of distinct values of the field found in this table, as compared to the total number of distinct values of this field in other tables in the data model. This is only relevant for key fields.
See: Creating a master dimension from the data model viewer
See: Creating a master measure from the data model viewer