
This section describes a number of different ways you can load your data into the Qlik Sense app, depending on how the data is structured and which data model you want to achieve.
Turning data columns into rows
My data probably looks like this, and I want to have the sales figures in a separate field:
| Year | Q1 | Q2 | Q3 | Q4 |
|---|---|---|---|---|
| 2013 | 34 | 54 | 53 | 52 |
| 2014 | 47 | 56 | 65 | 67 |
| 2015 | 57 | 56 | 63 | 71 |
Proposed action
Use the Crosstable prefix when you load the table.
The result will look like this:
| Year | Quarter | Sales |
|---|---|---|
| 2013 | Q1 | 34 |
| 2013 | Q2 | 54 |
| 2013 | Q3 | 53 |
| 2013 | Q4 | 52 |
| 2014 | Q1 | 47 |
| ... | ... | ... |
See: Working with cross tables
See: Crosstable
Turning data rows into fields
I have a generic table with three fields similar to this, and I want to have each attribute as a separate table:
| Object | Attribute | Value |
|---|---|---|
| ball | color | red |
| ball | diameter | 25 |
| ball | weight | 3 |
| box | color | 56 |
| box | height | 30 |
| box | length | 20 |
| box | width | 25 |
Proposed action
Create a generic data model using the Generic load prefix.
You will get a data model that looks like this:
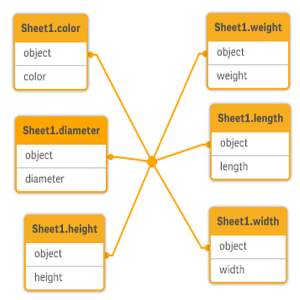
See: Generic databases
See: Generic
Loading data that is organized in hierarchical levels, for example an organization scheme.
My data is stored in an adjacent nodes table that looks like this:
| NodeID | ParentNodeID | Title |
|---|---|---|
| 1 | - | General manager |
| 2 | 1 | Country manager |
| 3 | 2 | Region manager |
Proposed action
Load the data with the Hierarchy prefix to create an expanded nodes table
| NodeID | ParentNodeID | Title | Level1 | Level2 | Level3 |
|---|---|---|---|---|---|
| 1 | - | General manager | General manager | - | - |
| 2 | 1 | Country manager | General manager | Country manager | - |
| 3 | 2 | Region manager | General manager | Country manager | Region manager |
See: Hierarchies
See: Hierarchy
Loading only new or updated records from a large database
I have a database with a large number of records, and I don't want to reload the entire database to refresh the data in my app. I only want to load new or updated records, and remove records that are deleted from the database.
Proposed action
Implement an incremental load solution using QVD files.
See: Using QVD files for incremental load
Combining data from two tables with a common field
Qlik Sense will associate tables with a common field automatically, but I want to control how the tables are combined.
Proposed action : Join / Keep
You can combine two tables into a single internal table with the Join or Keep prefixes.
See: Combining tables with Join and Keep
Proposed action : Mapping
An alternative to joining tables is to use mapping, which automates lookup of associated values in a mapping table. This can reduce the amount of data to load.
See: Using mapping as an alternative to joining
Matching a discrete value to an interval
I have a table of discrete numeric values (Event), and I want to match it to one or more intervals (Start and End).
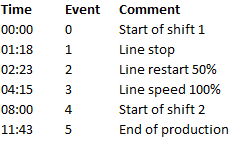
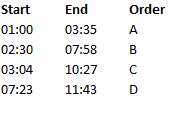
Proposed action
Use the IntervalMatch prefix to link the Time field with the interval defined by Start and End.
See: Matching intervals to discrete data
If the interval is not defined explicitly with start and end, only with a change timestamp like in the table below,you need to create an interval table.
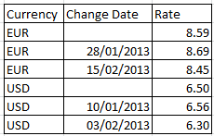
See: Creating a date interval from a single date
Handling inconsistent field values
My data contains field values that are not consistently named in different tables. For example, one table contains the value US in Country while another table contains United States. This situation will prevent associations..
| Country | Region | Country | Population | |
|---|---|---|---|---|
| US | Maryland | United States | 304 | |
| US | Idaho | Japan | 128 | |
| US | New York | Brazil | 192 | |
| US | California | China | 1333 |
Proposed action
Perform data cleansing using a mapping table, that will compare field values and enable correct associations.
See: Data cleansing
Loading geospatial data to visualize data with a map
I have data that I want to visualize using a map, for example sales data per country, or per store. To use the map visualization I need to load area or point data.
Proposed action
You can load area or point data that match your data value locations from a KML file or an Excel file. Additionally, you need to load the actual map background.
See: Loading map data