
To be able to create a map visualization, you need to load point data or area data.
You can load map data from KML files and Excel files. You load the data either through the data manager or the data load editor. By default, all fields are selected in the data selection dialog, even if they do not contain any data. A KML file could contain, for example, area data but no point data. Although there is nothing wrong with loading empty fields, it can be inconvenient to have empty fields when you are working with the map visualization. Adding a dimension without any data to a map will not generate any visual output and could confuse a user. Therefore, you should clear the selections of all empty data fields in the data selection dialog, before you load the data.
Creating a map from data in a KML file
Normally, a KML file contains point data, area data, or both. In the following screenshot, from the data selection dialog, you can see that the selection of the field FloridaCounties.Point has been cleared because the field does not contain any data. By clearing the field you will not run the risk of creating map dimensions without any data.
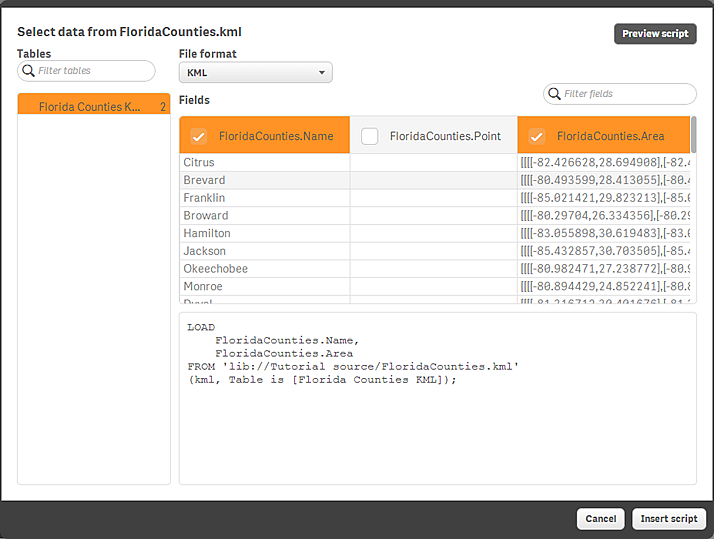
When you click Insert script, the following script is generated:
If the selection of the empty field had not been cleared, the script would also have contained the following string:
When you run the script and add a map chart to the sheet, you can add either FloridaCounties.Area (area) or FloridaCounties.Name (area) as a dimension.
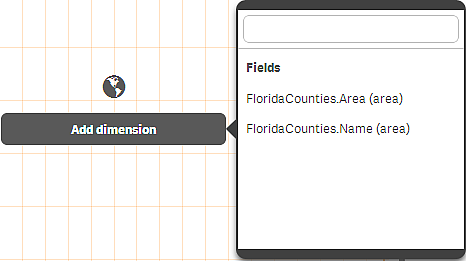
Although you will get the same visual result with either of the fields (a map with the counties), there will be a difference when you hover (tap on a touch device) over a county. If you select FloridaCounties.Name (area), the name of the county is shown as a tooltip, and if you select FloridaCounties.Area (area) the area data is shown. The name of the county is undoubtedly more interesting. In addition, loading the field FloridaCounties.Area is much slower than loading the field FloridaCounties.Name.
Optionally, you can also add a measure and use coloring by measure to reflect the difference in measure value between the different counties.
Creating a map from point data in an Excel file
You can create a map by using point data (coordinates) from an Excel file.
Point data formats
Point data can be read from Excel files. Two formats are supported:
- The point data is stored in one column. Each point is specified as an array of x and y coordinates: [x, y]. With geospatial coordinates, this would correspond to [longitude, latitude]. When using this format, you need to tag the point data field with $geopoint;.
- The point data is stored in two columns, one for latitude and one for longitude. The function GeoMakePoint() generates a point based on this format.
In the following examples we assume that the files contain the same data about the location of a company's offices, but in two different formats.
Example 1:
The Excel file has the following content for each office:
- Office
- Location
- Number of employees
The load script could look as follows:
The field Location contains the point data and it is necessary to tag the field with $geopoint; so that it is recognized as a point data field. Add the following string after the last string in the LOAD command:
The complete script then looks as follows:
Run the script and create a map visualization. Add the point dimension to your map.
Example 2:
The Excel file has the following content for each office:
- Office
- Latitude
- Longitude
- Number of employees
The load script could look as follows:
Combine the data in the fields Latitude and Longitude to define a new field for the points.
Run the script and create a map visualization. Add the point dimension to your map.
You can choose to create the dimension Location in the script by adding the following string above the LOAD command:
LOAD *, GeoMakePoint(Latitude, Longitude) as Location;
The function GeoMakePoint() joins the longitude and latitude data together.
The complete script then is as follows:
Run the script and create a map visualization. Add the point dimension to your map.
Number of points
For performance reasons, there is a limit to the number of points that can be displayed. By making selections, you can reduce the amount of data to display.