
Treemaps display hierarchical data by using nested rectangles, that is, smaller rectangles within a larger rectangle.
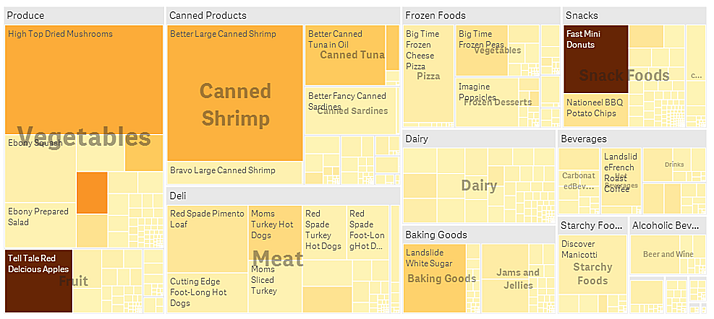
In this image you have several product groups, such as Produce, Canned Products, and Frozen Foods. Each product group consists of a large rectangle. You can regard the product groups as branches of the tree. When you select a product group, you drill down to the next level, the product type, for example, Vegetables, Meat, and Dairy. You can regard the product types as sub-branches of the tree. The branches have leaves. A leaf node's rectangle has an area proportional to a specified dimension of the data. In this example, the items Ebony Squash, Bravo Large Canned Shrimp, Red Spade Pimento Loaf, and so on, are the leaves. The leaf nodes are colored to show a separate dimension of the data.
Sorting is automatic according to size. By default, the coloring is by dimension, with 12 colors, but that can be changed in the properties panel. When you have more than one dimension, you can decide which dimension to color by. In this example, the coloring is not by dimension, but by expression (Avg(Margin)), a calculated measure, and by using this expression, you can see which items have the highest average margin. The darker the color, the higher the average margin.
If the data set contains negative values, a text message is shown stating that the negative values cannot be displayed.
Number of dimensions and measures
In a tree map you need at least one dimension and one measure, but to make full use of the treemap it is preferable to have two or three dimensions. You can only have one measure, but up to 15 dimensions. However, using more than two or three dimensions is not recommended because the treemap may become unmanageable.