
When you analyze your data, you have different ways of making selections. In a scatter plot you can either use lasso selection, range selection, draw selection, or click selection. To confirm a selection, click or outside the visualization. You can also press Enter. To cancel, click or press Esc.
Range selection
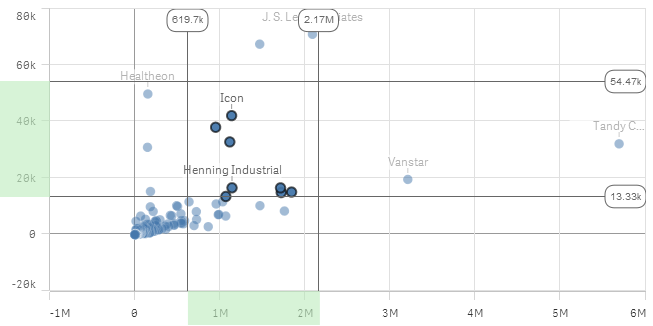
In range selection, you can make selections on the x-axis or the y-axis, or both together. Select a starting point along the axis, just outside the chart area, and drag to make a selection. As soon as you start dragging, a starting point line is displayed as well as an end point line that shows the selection. You can adjust your selection by dragging the lines, the value boxes, or the green selection area.
Lasso selection
In lasso selection, you can draw a lasso freehand to enclose an area. You must close the area properly by returning to the starting point of your selection.When you want to make a draw or lasso selection, you must first click inside the visualization and turn on lasso selection by clicking at the top of the visualization. On a computer you can also press Shift and make the selection.
Draw selection
In draw selection, you can make a selection by drawing one or more lines in the chart. All data points that are touched by a line are selected, and all other data points are dimmed. To deselect a data point, click it. When you want to make a draw or lasso selection, you must first click inside the visualization and turn on lasso selection by clicking at the top of the visualization. On a computer you can also press Shift and make the selection.
Click selection
In click selection, you can make a selection by clicking data points, one at a time. To deselect a data point, click it.