
When you analyze your data, you have different ways of making selections. In a pie chart you can either use click selection, draw selection, legend selection, or lasso selection. To confirm a selection, click or outside the visualization. You can also press Enter. To cancel, click or press Esc.
Click selection
In click selection you can make a selection by clicking sectors, one at a time. To deselect a sector, click it.
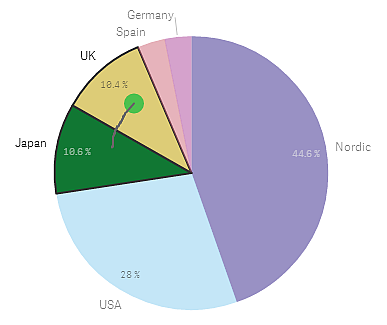
Draw selection
In draw selection you can make a selection by drawing one or more lines in the chart. All sectors that are touched by a line are selected, all other sectors are dimmed. To deselect a sector, click it. When you want to make a draw or lasso selection, you must first click inside the visualization and turn on lasso selection by clicking at the top of the visualization. On a computer you can also press Shift and make the selection.
Legend selection
There are two legend types: box legend, with one legend item per dimension value, and range legend, with a gradient scale, where all measure values are represented. In the box legend, you select and deselect the items one at a time by clicking them. In the range legend, you drag from a starting point to an end point to enclose an area. You cannot deselect a certain item, but you can change the range.
Lasso selection
In lasso selection, you can draw a lasso freehand to enclose an area. You must close the area properly by returning to the starting point of your selection.When you want to make a draw or lasso selection, you must first click inside the visualization and turn on lasso selection by clicking at the top of the visualization. On a computer you can also press Shift and make the selection.
Label selection
You can click the dimension labels to make selections.