When you analyze your data, you have different ways of making selections. In a line chart you can either use range selection, lasso selection, draw selection, click, or legend selection. To confirm a selection, click or outside the visualization. You can also press Enter. To cancel, click or press Esc.
Range selection
In range selection, you can make selections either on the x-axis or the y-axis, one at a time. Select a starting point along the axis, just outside the chart area, and drag to make a selection. As soon as you start dragging, a starting point line is displayed, as well as an end point line that shows the selection. You can adjust your selection by dragging the lines, the value boxes, or the green selection area.
Lasso selection
In lasso selection, you can draw a lasso freehand to enclose an area. You must close the area properly by returning to the starting point of your selection.When you want to make a draw or lasso selection, you must first click inside the visualization and turn on lasso selection by clicking at the top of the visualization. On a computer you can also press Shift and make the selection.
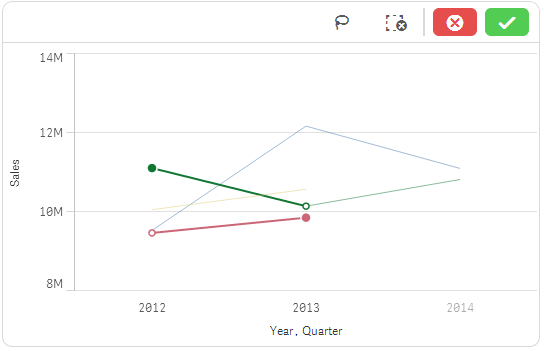
Draw selection
In draw selection, you can make a selection by drawing one or more lines in the chart. All data points that are touched by a line are selected. To deselect a data point, click it. When you want to make a draw or lasso selection, you must first click inside the visualization and turn on lasso selection by clicking at the top of the visualization. On a computer you can also press Shift and make the selection.
Click selection
In click selection, you can make a selection by clicking the data points, one at a time. To deselect a data point, click it.
Legend selection
In the box legend, you select and deselect the items one at a time by clicking them.
Label selection
You can click the dimension labels to make selections. When dimensions are grouped or stacked, the whole group or stack is selected.
Indirect selection
When you have a line chart with two dimensions and make a selection of two measure values for two different dimension values, as illustrated in the image, Qlik Sense makes indirect selections of the corresponding dimension values, so that the selection becomes the same as you would achieve when using range selection for the area. The data values selected by Qlik Sense are unfilled.