You use a combination of dimensions and measures to supply the visualizations with data. The visualizations are dynamic and change according to your selections when you are analyzing your data.
You use dimensions to determine how the data from the measure is to be grouped - for example total sales per country or number of products per supplier. You typically find a dimension representing the slices in a pie chart or on the x-axis of a bar chart with vertical bars.
You use a measure to decide what part of the data to show in the visualization. For example, the total sales or number of products. A measure is a calculation that uses one or several records in the loaded data together with aggregation functions such as sum or max. You typically find a measure on the y-axis of a bar chart with vertical bars.
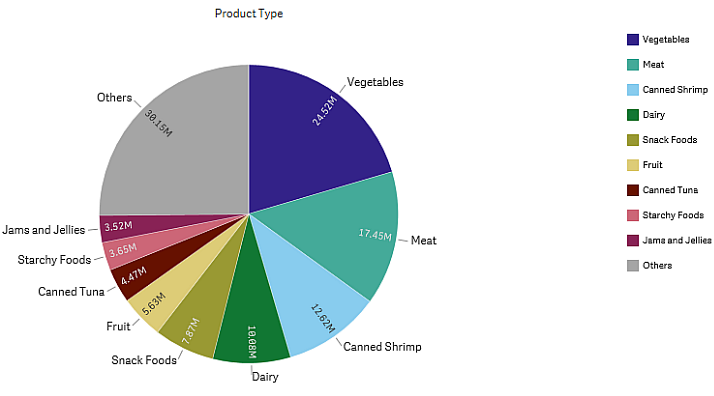
Example 1:
Your data source contains information about costs for different products that are grouped into categories. You use a dimension to determine what to calculate the cost for: Product Type. You use a measure to calculate the cost: sum (Cost).
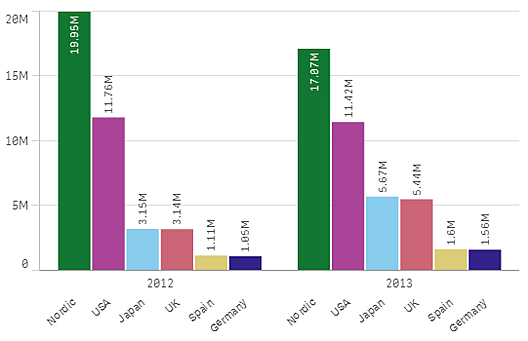
Example 2:
Your data source contains information about sales figures over time in different countries. You use dimensions to categorize the sales: Year and Region. You use a measure to calculate the sales amount: sum (Sales).