
People chart demonstrates a simple chart with basic HTML rendering and selection support. It shows how to enable dimensions and measures and how to make a simple visualization. It also gives an example on how to enable selections in a visualization.
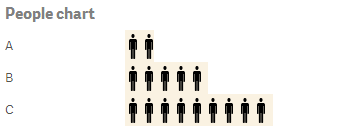
The measure is depicted as a person like in the example below:
Finding the code examples
In a Qlik Sense Desktop environment, you find the code examples in ...\Users\<UserName>\Documents\Qlik\Examples\Extensions.
In a Qlik Sense environment, you find the code examples in ...\ProgramData\Qlik\Examples\Extensions.
Full code example
Code example breakdown
-
Edit the applicable fields of the qext file to set a default title, description, icon and type.
-
Define properties. We define the properties for the extension in our JavaScript code. In this example we do this in a separate file, peoplechart-properties.js, which we then load in our define:
define(["jquery", "./peoplechart-properties", "text!./peoplechart.css"], function($, properties, cssContent) { 'use strict'; $("<style>").html(cssContent).appendTo("head");Tip noteFor further definition of properties, see Define properties. -
Enable selections.
Use the selectValues function to reuse Qlik Sense standard selection UI. Also make sure to set the “selected” CSS class on selected elements:
$element.find('.selectable').on('qv-activate', function() { if(this.hasAttribute("data-value")) { var value = parseInt(this.getAttribute("data-value"), 10), dim = 0; self.selectValues(dim, [value], true); $(this).toggleClass("selected"); } }); -
Implement paint method.
In the paint method we create the html for our extension based on data in the layout parameter. Refer to paint method for details on this.
Then we set the content of the $element parameter to display the extension content.
Also, tag your elements with class='selectable' data-value=’0’.
paint : function($element, layout) { var self = this, html = "", measures = layout.qHyperCube.qMeasureInfo, w = $element.width() - 130, qData = layout.qHyperCube.qDataPages[0], vmax = (measures && measures[0]) ? measures[0].qMax * 1.5 : 1; if(qData && qData.qMatrix) { $.each(qData.qMatrix, function(key, row) { if(row.length > 1) { //dimension is first, measure second var dim = row[0], meas = row[1]; if(dim.qIsOtherCell) { dim.qText = layout.qHyperCube.qDimensionInfo[0].othersLabel; } html += '<div title="' + dim.qText + ':' + meas.qText + '"'; //negative elementnumbers are not selectable if(dim.qElemNumber > -1) { html += "class='selectable' data-value='" + dim.qElemNumber + "'" } html += '>'; html += "<div class='label'>" + dim.qText + "</div>"; html += "<div class='bar' style='width:" + Math.round(w * (meas.qNum / vmax )) + "px;'> </div>"; html += "</div>"; } }); $element.html(html); -
Enable snapshots for use in storytelling:
snapshot : { canTakeSnapshot : true },Tip noteFor more information about the snapshot method, see snapshot property. -
Add styling to separate CSS file:
It is good programming practice to keep your styling in a separate CSS file. Qlik Sense set the CSS class qv-object-[extension name] on your extensions. You should prefix your CSS rules with that. You then load your CSS file with requires and add its content to the HTML page:
define(["jquery", "./peoplechart-properties", "text!./peoplechart.css"], function($, properties, cssContent) { 'use strict'; $("<style>").html(cssContent).appendTo("head"); -
In the properties JavaScript-file, we first need to define the accordions to reuse on the properties panel:
return { type: "items", component: "accordion", items: { dimensions: { uses: "dimensions" }, measures: { uses: "measures" }, sorting: { uses: "sorting" },settings: { uses: "settings" } } }; -
Since we are creating a chart we make sure that we define that we need one dimension and one measure:
return { type: "items", component: "accordion", items: { dimensions: { uses: "dimensions", min: 1, max: 1 }, measures: { uses: "measures", min: 1, max: 1 }, sorting: { uses: "sorting" }, settings: { uses: "settings" } } };