Using expressions to create dynamic chart titles, subtitles, and footnotes
This video shows you howto use expressions to create dynamic chart titles, subtitles, and footnotes in Qlik Sense and Qlik Cloud to enhance your data visualizations and make them more interactive and informative.
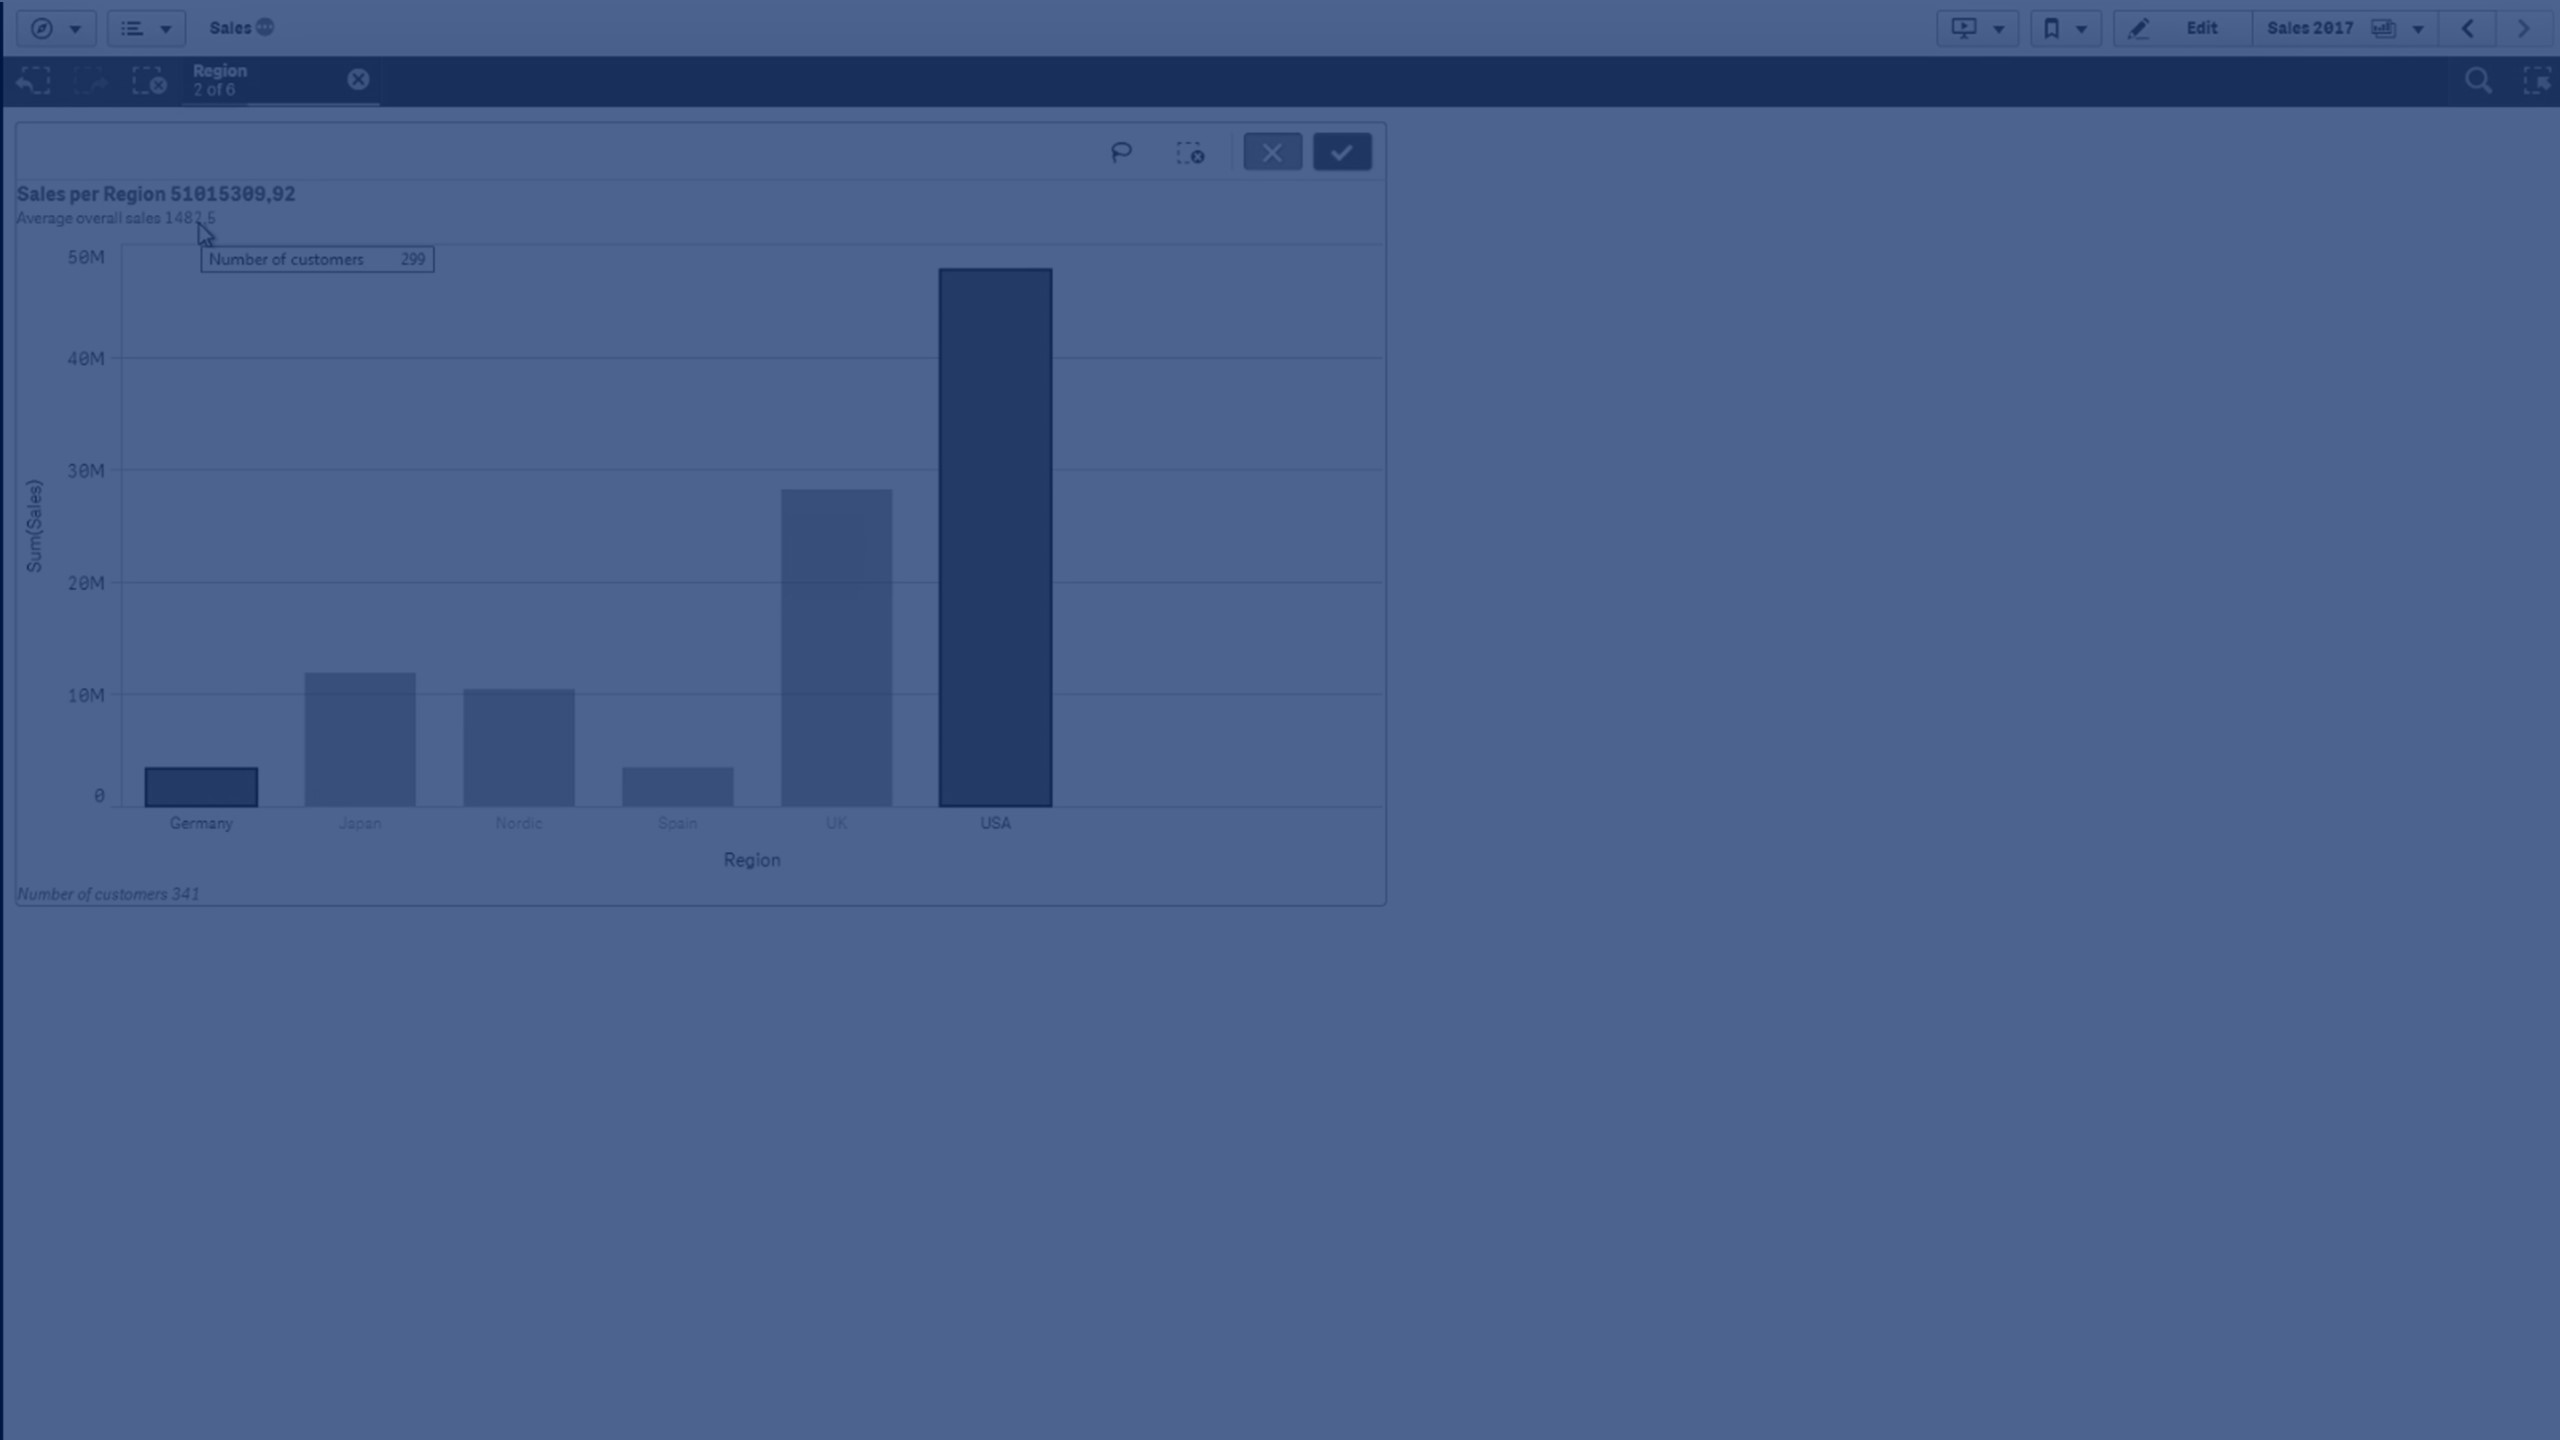
In the first example, we'll use the sum of sales as a measure and region as a dimension to display sales data by region. Under the appearance tab, we'll name the chart "Sales per Region" and make the title dynamic by adding an expression for the sum of sales.
In the second example, we'll add a subtitle featuring the average overall sales, incorporating an expression to keep it dynamic. We'll refine the subtitle further by using the num function to format the number.
In the third example, we'll add a dynamic footnote displaying the total number of customers using a count function. As we exit edit mode, watch how the title, subtitle, and footnote update automatically with chart selections.