
Visualizing positive and negative contributions to the result with a waterfall chart
This example shows how to make a waterfall chart to visualize how positive and negative values contribute to the final result.
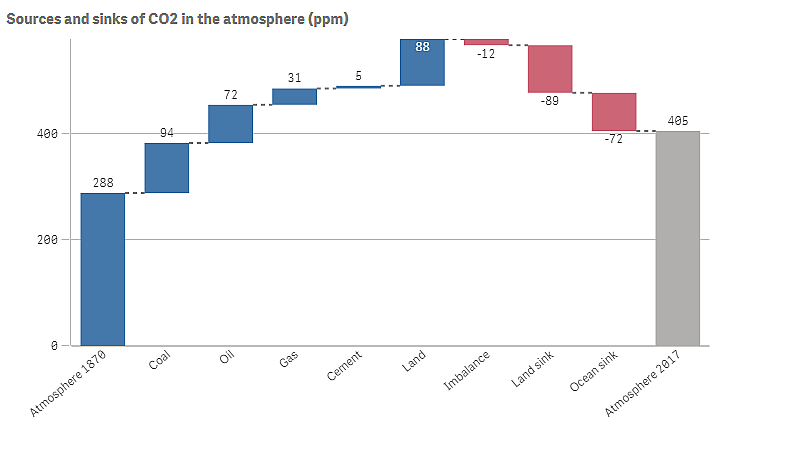
We want to see the positive contributions to CO2 in the atmosphere, such as oil or gas, in relation to negative factors, such as land sink.
Dataset
In this example, we will use a simple dataset that you can copy to a text file to use as data source. It contains the atmosphere CO2 level in ppm from 1870, as well as the positive and negative contributors to CO2 in the atmosphere in the time between 1870 and 2017.
Atmosphere 1870,Coal,Oil,Gas,Cement,Land,Imbalance,Land sink,Ocean sink,Atmosphere 2017
288,94,72,31,5,88,-12,-89,-72,405Add the text file as data source in an empty app, and load the data. Make sure that you use comma as field delimiter.
Visualization
We add a waterfall chart to the sheet and add the fields as measures in the following order. Edit the label for each measure to remove the Sum() part.
- Sum(Atmosphere1870)
- Sum(Coal)
- Sum(Oil)
- Sum(Gas)
- Sum(Cement)
- Sum(Land)
- Sum(Imbalance)
- Sum(Land_sink)
- Sum(Ocean_sink)
To add a bar that shows the calculated result, the CO2 level for 2017, open the final measure and select Subtotals. You can set Subtotal label to Atmosphere 2017.
Discovery
.As you can see in the chart, the CO2 level in the atmosphere is higher in 2017 than in 1870. Coal is the main contributor of CO2. Some of the increase is offset by carbon sinks that absorb CO2, for example, the ocean. As we can see, this is unfortunately not enough to stop the increase of CO2 in the atmosphere