Creating tables
This section describes how to create tables with the Visualization API and qlik-visual.
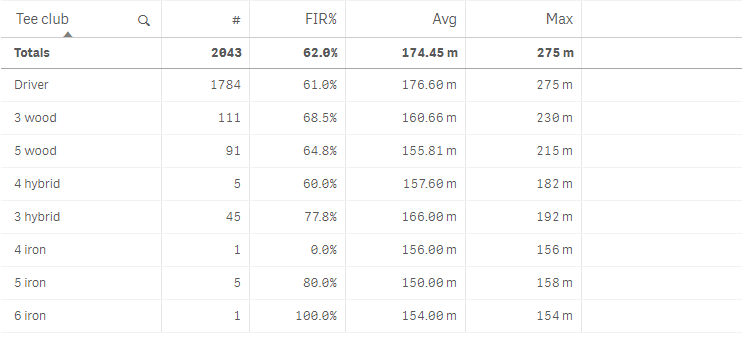
Creating a basic table
In this example we create a basic table, containing one dimension and four measures. The measures have basic number formatting applied and the dimension is sorted by load order. No options are defined for the table.
- Create the chart
Create the container for the chart. The visualization type is table.
Visualization API
app.visualization.create(
  'table',
  [],
  {}
)
qlik-visual
<qlik-visual appid="Tutorial-Golf.qvf" type="table" cols='[]' options='{}' > </qlik-visual> - Define the first dimension
We start by adding the dimension. Note the sort order definition in the qSortCriterias object and that null values have been suppressed.
{ "qDef": { "qFieldDefs": [ "=If(Par>3,TClubName)" ], "qFieldLabels": [ "Tee club" ], "qSortCriterias": [ { "qSortByLoadOrder": 1 } ] }, "qNullSuppression": true } - Define the first measure
We then add the first measure.
{ "qDef": { "qLabel": "#", "qDef": "Count(HoID)" } } - Define the second measure
Then we add the second measure and apply custom number formatting to it as we want it to be shown in percent.
{ "qDef": { "qLabel": "#", "qDef": "Count(HoID)" } }, { "qDef": { "qLabel": "FIR%", "qDef": "Avg(FwHit)", "qNumFormat": { "qType": "F", "qnDec": 2, "qUseThou": 0, "qFmt": "0.0%", "qDec": ".", "qThou": "," } } } - Define the third measure
We add the third measure and apply custom number formatting to it. This time we want to show the measure value as numbers with an addition to indicate that the number is in meters.
{ "qDef": { "qLabel": "#", "qDef": "Count(HoID)" } }, { "qDef": { "qLabel": "FIR%", "qDef": "Avg(FwHit)", "qNumFormat": { "qType": "F", "qnDec": 2, "qUseThou": 0, "qFmt": "0.0%", "qDec": ".", "qThou": "," } } }, { "qDef": { "qLabel": "Avg", "qDef": "Avg(DrDist)", "qNumFormat": { "qType": "F", "qnDec": 2, "qUseThou": 0, "qFmt": "#,##0.00 m", "qDec": ".", "qThou": "," }, "numFormatFromTemplate": false } } - Define the fourth measure
Finally, we add the fourth measure. We apply custom number formatting to it as well and just as for the third measure we want to show the measure value as numbers with an addition to indicate that the number is in meters.
{ "qDef": { "qLabel": "#", "qDef": "Count(HoID)" } }, { "qDef": { "qLabel": "FIR%", "qDef": "Avg(FwHit)", "qNumFormat": { "qType": "F", "qnDec": 2, "qUseThou": 0, "qFmt": "0.0%", "qDec": ".", "qThou": "," } } }, { "qDef": { "qLabel": "Avg", "qDef": "Avg(DrDist)", "qNumFormat": { "qType": "F", "qnDec": 2, "qUseThou": 0, "qFmt": "#,##0.00 m", "qDec": ".", "qThou": "," }, "numFormatFromTemplate": false } }, { "qDef": { "qLabel": "Max", "qDef": "Max(DrDist)", "qNumFormat": { "qType": "F", "qnDec": 2, "qUseThou": 0, "qFmt": "#,##0 m", "qDec": ".", "qThou": "," }, "numFormatFromTemplate": false } }
Result
Code examples
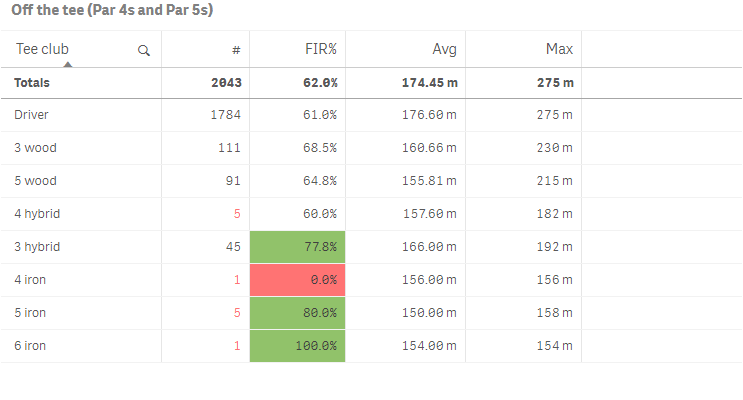
Using background color and text color
In this example we use expressions to color the cell backgrounds and the text in tables. This enables you to use expressions to define both the colors used and the conditional values upon which the colors are applied in a visualization.
Background colors and text colors are defined in the qAttributeExpressions object inside the applicable measure definition in the columns.
Note that the definition of qAttributeExpressions for straight tables is different from the definition for pivot tables.
- Text color for first measure
We add a text color condition to the first measure: "qAttributeExpressions": [ { "qExpression": "If(Count(HoID)<10,RGB(255, 115, 115))", "id": "cellForegroundColor" } ]. Text color is defined with "id": "cellForegroundColor".
{ "qDef": { "qLabel": "#", "qDef": "Count(HoID)" }, "qAttributeExpressions": [ { "qExpression": "If(Count(HoID)<10,RGB(255, 115, 115))", "id": "cellForegroundColor" } ] }, - Background color for second measure
We then add a background color condition to the second measure: "qAttributeExpressions": [ { "qExpression": "If(Avg(FwHit)<0.5,RGB(255, 115, 115),If(Avg(FwHit)>0.7,RGB(145, 194, 106)))", "id": "cellBackgroundColor" } ]. Background color is defined with "id": "cellBackgroundColor".
{ "qDef": { "qLabel": "FIR%", "qDef": "Avg(FwHit)", "qNumFormat": { "qType": "F", "qnDec": 2, "qUseThou": 0, "qFmt": "0.0%", "qDec": ".", "qThou": "," } }, "qAttributeExpressions": [ { "qExpression": "If(Avg(FwHit)<0.5,RGB(255, 115, 115),If(Avg(FwHit)>0.7,RGB(145, 194, 106)))", "id": "cellBackgroundColor" } ] } - Define title
In this example we also add a title, which is defined in the options.
{ "showTitles": true, "title": "Off the tee (Par 4s and Par 5s)" }
Result
Code examples
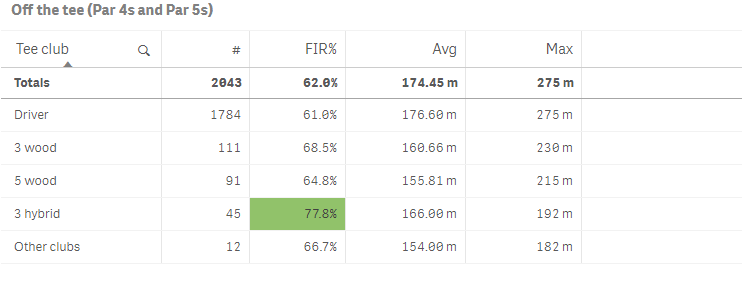
Applying dimension limits
In this example we want to display all items where the value of the first measure is greater than 5.
- Define the mode
We start by defining the mode. Since we want to limit the dimension values to an absolute value, we set "qOtherMode": "OTHER_ABS_LIMITED".
{ "qDef": { "qFieldDefs": [ "=If(Par>3,TClubName)" ], "qFieldLabels": [ "Tee club" ], "qSortCriterias": [ { "qSortByLoadOrder": 1 } ] }, "qNullSuppression": true, "qOtherTotalSpec": { "qOtherMode": "OTHER_ABS_LIMITED" } }, - Define the limit value
We then define the actual value: "qOtherLimit": {"qv": "5"}. Set "qOtherLimitMode": "OTHER_GT_LIMIT" to include only the values greater than what we defined in qOtherLimit.
Information note"qOtherLimit": {"qv": "5"} means that only the items with a value greater than 5 will be displayed.{ "qDef": { "qFieldDefs": [ "=If(Par>3,TClubName)" ], "qFieldLabels": [ "Tee club" ], "qSortCriterias": [ { "qSortByLoadOrder": 1 } ] }, "qNullSuppression": true, "qOtherTotalSpec": { "qOtherMode": "OTHER_ABS_LIMITED", "qOtherLimit": { "qv": "5" }, "qOtherLimitMode": "OTHER_GT_LIMIT" } }, - Additional settings
We want to define the sort order of the dimension values to sort descending: "qOtherSortMode": "OTHER_SORT_DESCENDING". We do not want any totals to be displayed and therefore set: "qTotalMode": "TOTAL_OFF".
Finally we set the label of the Others group: "qOtherLabel": { "qv": "Other clubs" }. Note that the label is not set inside the qOtherTotalSpec object.
{ "qDef": { "qFieldDefs": [ "=If(Par>3,TClubName)" ], "qFieldLabels": [ "Tee club" ], "qSortCriterias": [ { "qSortByLoadOrder": 1 } ] }, "qNullSuppression": true, "qOtherTotalSpec": { "qOtherMode": "OTHER_ABS_LIMITED", "qOtherLimit": { "qv": "5" }, "qOtherLimitMode": "OTHER_GT_LIMIT", "qOtherSortMode": "OTHER_SORT_DESCENDING", "qTotalMode": "TOTAL_OFF" }, "qOtherLabel": { "qv": "Other clubs" } },
Result