
Selecting the metrics to display
To select which metrics to display for the Qlik Sense services in the Microsoft Windows, Performance Monitor:
- Select Start>Run.
- Enter perfmon and click OK.
- In the left panel, expand Monitoring Tools .
- Select Performance Monitor.
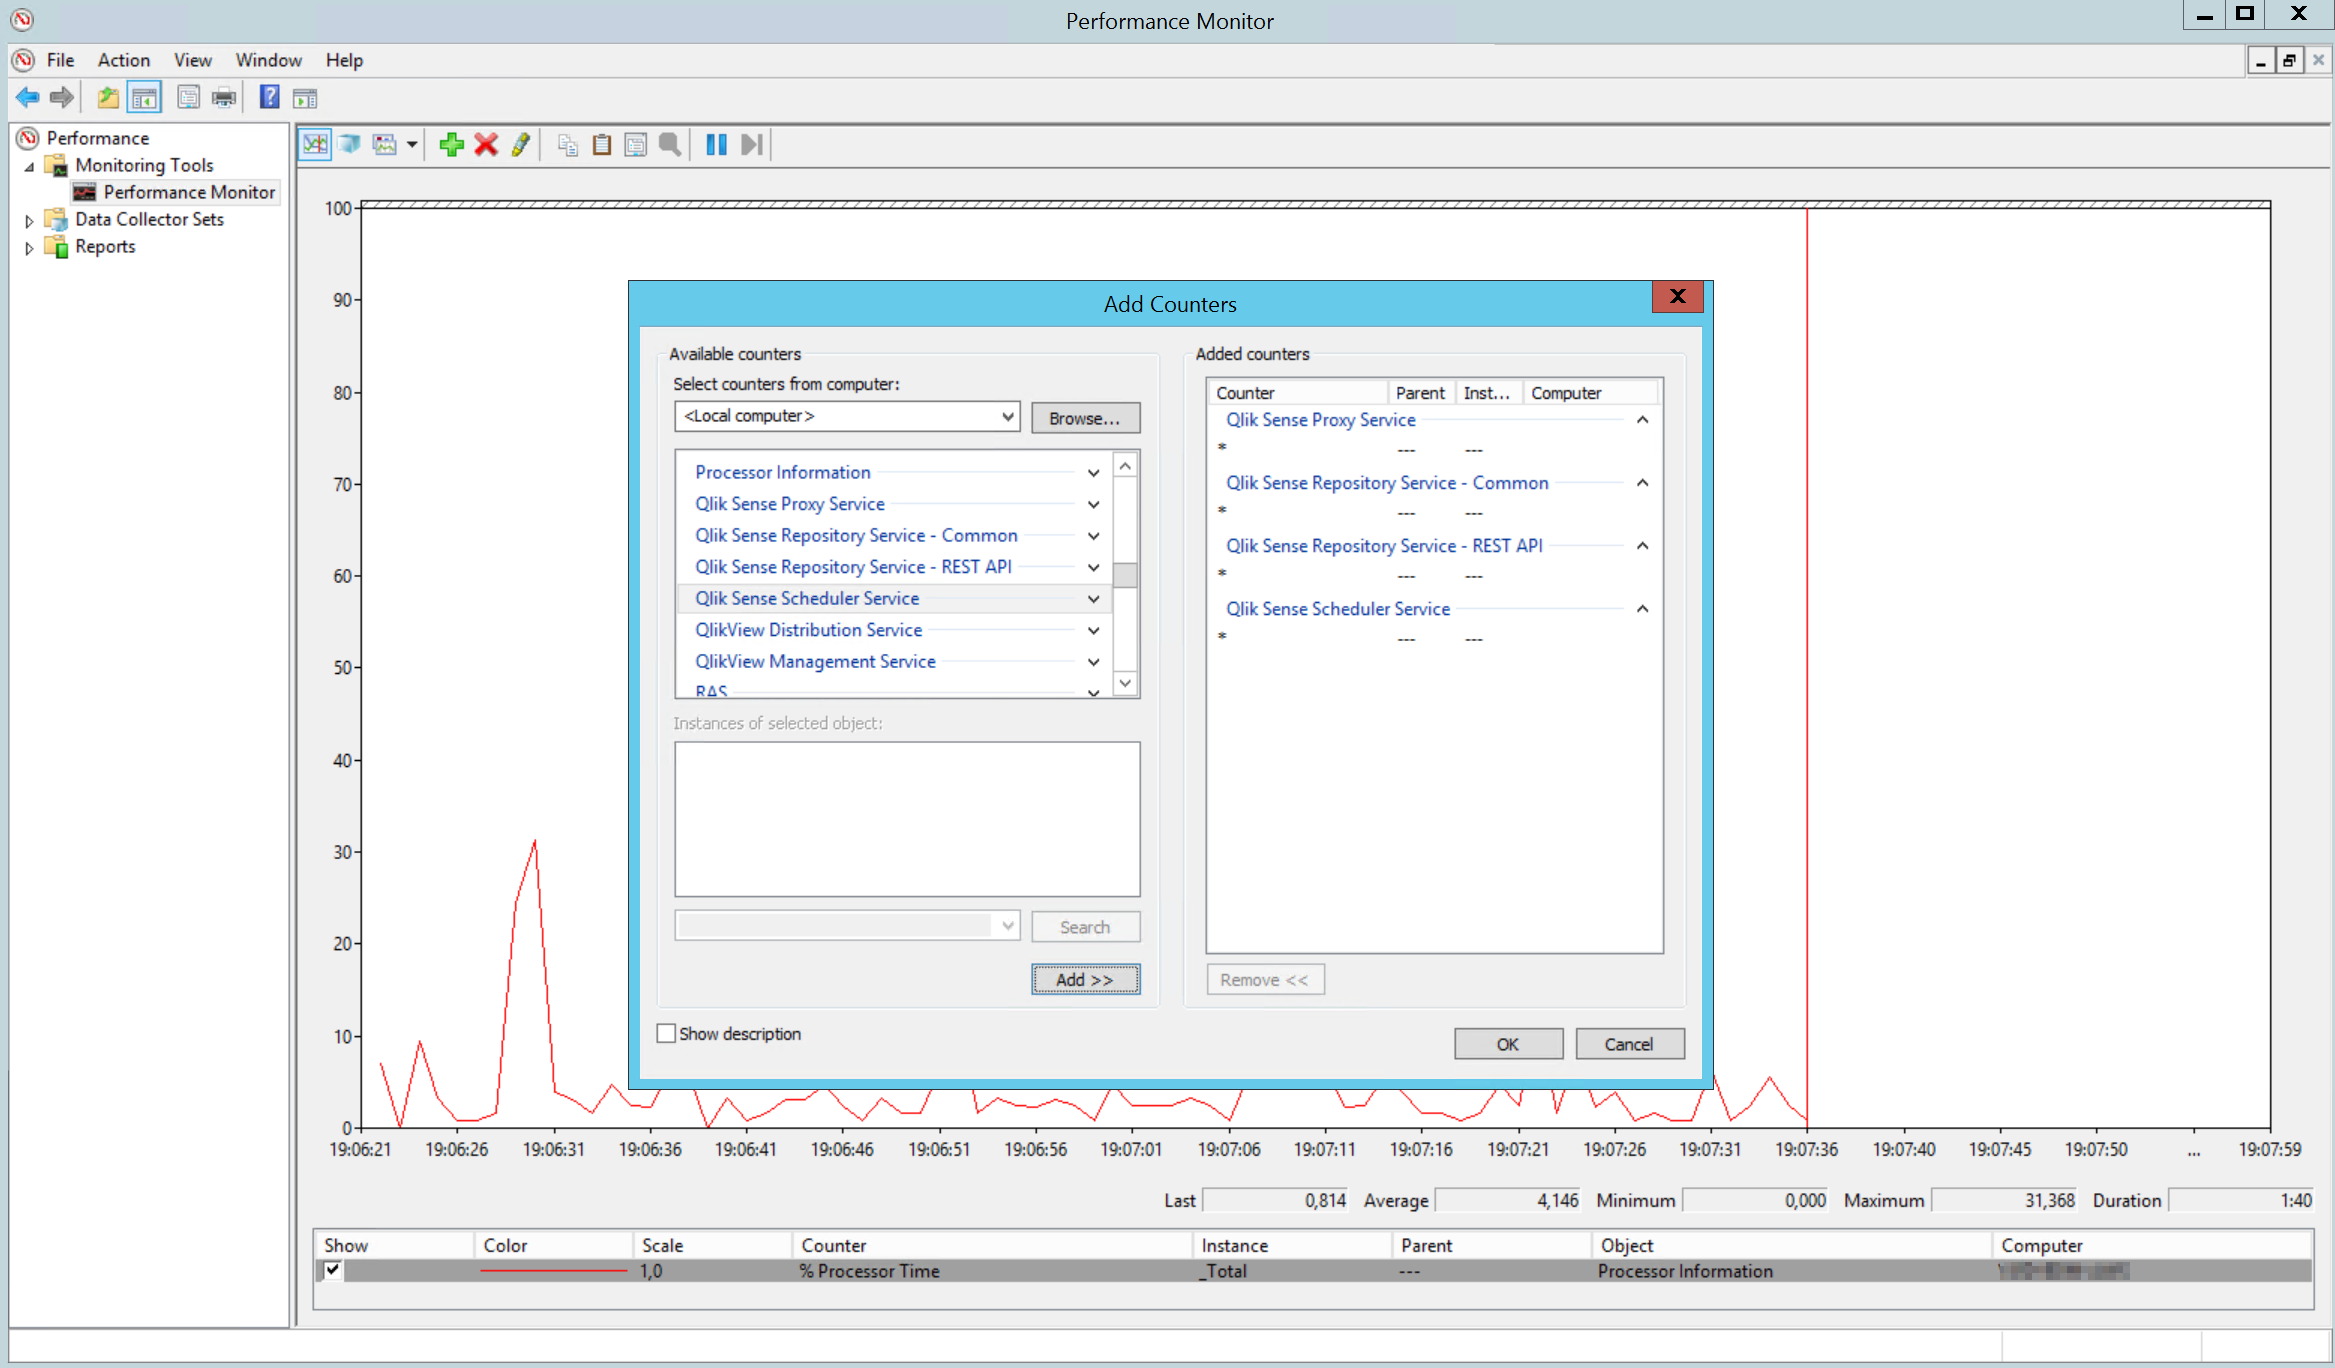
The Performance Monitor is displayed in the right panel. - Click the + (plus) icon in the toolbar at the top of the Performance Monitor.
The Add Counters dialog is displayed. - Select the computer to add counters from in the Select counters from computer: drop-down list.
The Available counters list is populated with counters. - In the Available counters list, locate the following counter sets :
- Qlik Sense Proxy Service
- Qlik Sense Repository Service - REST API
- Qlik Sense Repository Service
- Qlik Sense Scheduler Service
- Click the + (plus) sign next to a counter set to expand the set.
- In the Performance Monitor, select the counters to display .
- Click Add >> to add the counters.
-
The added counters are listed in the Added counters list.
- Click OK.
The counters you added are now displayed in the Performance Monitor.