
Task progress summary
To see Compose tasks, you need to start the task directly in Compose.
Switch to Tasks View to see a list of tasks. Expand the left pane and select the Compose Task Profile options according to the tasks or processes that you want to monitor.
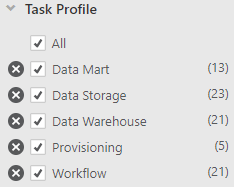
Data Warehouse tasks:
- Data Warehouse
- Data Mart
Data Lake tasks:
- Data Storage
Compose Workflows:
- Workflows
For each task, the following columns are available.
General columns
-
State: The current state of a task. Possible states are described in the table below. You can filter the task list using the States check boxes above the list.
Task states Task State Icon Description Running

The task is running.
Information noteA spinning circle icon will be shown when the task is in a "Starting" state.
Stopped

The task has not been run yet, the task was stopped, or the task completed successfully.
Starting 
The task is starting (indicated by a spinning circle) Error

The task has stopped due to a fatal error.
Recovering

The task is recovering from a recoverable error.
- Server: The name of the server on which the task is running.
- Task: The name of the task
-
Stage: The current stage of the task: Loading or Change Processing.
Information noteThe stage will remain "Loading", regardless of whether the task is actually loading data or not.
- Tables with Error: The number of tables in error state.
Not displayed by default:
- Description: A description of the task, as entered by the user in Compose.
- Loading Ended: Indicates whether loading has completed. This refers to completion of the Full Load stage in Replicate tasks and completion of the Full Load and/or Change Processing stage in Compose tasks.
- Project - The name of the Compose project.
- Source Name: The display name of the source database
- Server type: Compose
- Source Type: The source database type (e.g. Microsoft SQL Server)
- Target Name: The display name of the target database
- Target Type: The target database type
- Tags: The tags associated with a task
- Type: The type of task, which can be: Full Load only, CDC only, or Full Load & CDC
Loading columns
- Progress (%): The percentage of loading completed
Not displayed by default:
- Started: The date and time the loading started
- Ended: The date and time the loading ended
- Load Duration: The duration of the load process, in hh:mm:ss
- Total Tables: The total number of tables
- Tables Completed: The number of completed tables
- Tables Left: The number of tables remaining to be loaded
- Tables Loading: The number of tables currently loading
- Tables Queued: The number of tables in queue
- Total Commands: The number of commands executed in a Compose Task
- Commands Completed: The number of commands completed in a Compose Task
With Compose tasks, canceled tables are reflected in the Total Tables counter but not in the Completed/Loading/Queued/Error counters. Therefore, when one or more tables is canceled in a task, the sum of these counters will be less than the Total Tables.
Status summary
The Status Summary at the bottom of the window provides a quick overview of the current status of all monitored tasks and servers. It lists the following information:
-
For tasks: The total number of monitored tasks as well as the number of tasks that are running (green icon), stopped (gray icon), recovering (orange icon), and in error state (red icon)
Information noteThe "running" state also includes "starting" tasks. Similarly, the "stopped" state also includes "stopping" tasks.
You can double-click the task counters to open the corresponding Tasks View.
Note: The task counters do not reflect tasks on servers that are not currently monitored. For more information, see Additional server management options.
- For servers: The total number of servers, the number of servers that are running and successfully monitored (green icon), the number of servers that Enterprise Manager cannot monitor due to connectivity issues (red icon), and the number of servers that are not being monitored (gray icon)
Status Bar Example
