Adding data marts and star schemas
This topic explains how to create and manage data marts and star schemas in Qlik Compose. Since a data mart is essentially a subset of the data warehouse, you can create any number of data marts according to your BI needs. You can also create multiple star schemas for a single data mart. Star schemas allow you to reuse existing dimension tables within the same data mart, thereby saving space in the data warehouse while at the same time improving query performance. For example, you could create one star schema with an Order Details fact table and Customers and Products dimensions and another star schema with the same dimensions but a different fact type (or the same fact type, but different dimensions). This also allows you to generate BI reports using different facts that share the same dimensions. Additionally, in a star schema, dimensions are linked with each other through one join path intersecting the fact table, facilitating accurate and consistent query results.
- If you edit an expression or a column lookup in a dimension, the changes will not be applied to existing data. To apply such changes, you need to reload the data (which could take some time, depending on the number of records and whether there are a lot of historical records).
- Data warehouse tasks cannot run in parallel with data mart tasks.
A new data mart should be created in the following situations:
- Setting up a Compose project for the first time.
- To serve the needs of each individual business unit (different data marts can be used to obtain specific information for various enterprise departments, such as accounting, marketing, sales, and so on).
To create a data mart with a star schema:
-
Click the New button located at the bottom of the Data Mart panel.
OR
Click the Manage button and then click the New button located at the top of the Manage Data Marts window. The New Data Mart window opens.
-
Optionally change the default name and provide a description.
Warning noteData mart names cannot contain the following characters: /\,&#%$@=^*+"'`~?<>:;[]{} as well as all non-printable characters (below 0x20). The data mart name can contain a single dot, but it cannot be the first or last character. -
Make sure that the Start New Star Schema Wizard check box is selected (the default) and then click OK. The New Star Schema wizard opens.
- Provide a name and description (optional) for the star schema.
-
Select one of the available fact types:
-
Transactional - A star schema with a transactional fact table allows you to retrieve the desired data, even if a dimension table contains multiple versions of the same record. To use an example from the automotive industry, selecting "OrderDate" as the Transaction Date would allow you to generate a report for the number of customers who bought cars in New York between 2013 and 2016, even if a customer moved to a different city (which would also result in a new record being added to the Customers dimension).
- Aggregated - A star schema with an aggregated fact table allows you to make aggregate calculations based on the fact table attributes. For instance, you could create an aggregated fact that shows the total freight costs per shipping region and product category. Additionally, the presence of a transaction date in the fact table makes it possible to retrieve the desired data, even if a dimension contains multiple versions of the same record. To use an example from the shipping industry, a shipper could use an aggregated fact to generate a report for the total cost of shipping rice to Australia from 2015-2016.
- State Oriented - A star schema with a state oriented fact supports Type 2 columns in the fact table. This is useful in cases where the fact is not a singular event in time, but rather, consists of multiple "states" or events that occur over time. Typical example of facts with multiple states are insurance claims or flight reservations. There are also cases when the same entity is treated as both a fact and a dimension - for example, Customers. In such cases, a report could be generated that relates to the state of the fact, such as the time a claim was submitted to the time it was approved.
-
- Click Next.
-
In the Facts screen, choose one fact for the star schema and then click Next. The Dimensions screen is displayed. The left pane lists the dimensions that can be selected while the right pane displays a diagram of the star schema with the selected dimensions. You can view a dimension’s lineage by selecting the desired dimension and then clicking the Lineage button. For more information on lineage, see Lineage and impact analysis.
The left pane of the Dimensions screen contains the following areas:
- Existing Dimensions - Lists the dimensions that already exist in your data mart. Note that only dimensions that are relevant to the selected fact table will be displayed.
- Create New Dimensions - Lists all of the dimensions that can be added to the star schema.
-
Date Dimensions - Lists all of the Date dimensions that can be added to the star schema. Note that these dimensions will only be available for selection if you added the Date and Time entities to your model. For an explanation of how to do this, see Adding Date and Time entities to your model.
-
Time Dimensions - Lists all of the Time dimensions that can be added to the star schema. Note that these dimensions will only be available for selection if you added the Date and Time entities to your model. For an explanation of how to do this, see Adding Date and Time entities to your model.
Information noteWhen adding dimensions using the wizard, if a root dimension already exists in the data mart, any dimensions selected under the root dimension will be ignored.
Workaround: Edit the dimension and delete or add columns as required.
- Choose which dimensions to include in the star schema and then click Next.
- If you chose Star Schema with State Orientation as your star schema type, click Finish. Otherwise, continue from Step 10 below.
-
In the Transaction Date screen, choose which Transaction Date to include in the data mart fact table. Selecting a Transaction Date enables you to retrieve the required data, even if the Dimension table contains multiple versions of the same record.
For example, a car salesman wants to know how many customers bought cars in New York between 2013 and 2015. Selecting OrderDate as the Transaction Date for the Customers Dimension would make it possible to retrieve this information, even if a customer moved to a different city (which would also result in a new record being added to the data mart).
- If you chose Transactional as your star schema fact type, click Finish. If you chose Aggregated as your star schema fact type, continue from Step 12 below.
-
In the Aggregated Fact screen:
-
Select one or more columns from the Fact table on the left of the screen.
Information noteYou can select multiple columns by holding down the [Shift] (sequential selection) or [Ctrl] (non-sequential selection) buttons while selecting the columns.
- To add the column(s) to the Group By list on the right, either drag the columns to the list or click the arrowhead button to the left of the Group By list. Note that each dimension has a default "Group By" column that cannot be deleted.
- To add the column(s) to the Aggregations list on the right, either drag the columns to the list or click the arrowhead button to the left of the Aggregations list.
-
To add new columns to the Group By or Aggregations list, click the New button above the list. In the New column window, specify a Name, Type, Description and Aggregation (when adding a new aggregation column) and then click OK. The column is added to the list.
-
To add an expression, hover the mouse cursor over the table cell in the Expression column and then click the fx button that appears on the right. The Edit Expression: <Name> window opens.
For more information on creating expressions, see Creating expressions.
-
To delete a column, select the column in the list and then click the Delete button above the list.
Information noteYou can select multiple columns for deletion by holding down the [Shift] (sequential selection) or [Ctrl] (non-sequential selection) buttons while selecting the columns.
See also Aggregation example.
-
-
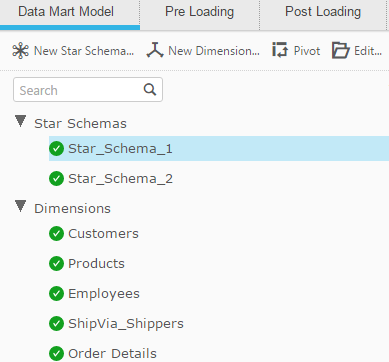
Click Finish. The newly created star schema is displayed below the Star Schemas heading, as shown below.

-
Click the Create Tables toolbar button. The Creating Data Mart: Data Mart Name in Target progress window opens. Wait for the "Create Data Mart tables finished successfully." message to be displayed and then click Close.
Information noteAfter the data mart tables are created, the Create Tables button changes to Drop and Recreate tables.
-
Do one of the following:
-
To generate the task with basic validations, click the Generate toolbar button.
By default, Compose generates the task with basic validations. Basic validations are suitable for most tasks, but are especially useful for tasks with numerous expressions and lookups, as generating such tasks with all validations could take a long time.
-
To generate the task with all validations, click the inverted triangle to the right of the Generate button and select With all validations from the drop-down menu.
All validations includes validations that access the database to verify the existence of columns used in expressions and lookups. As selecting With all validations will significantly lengthen the time it takes to generate the task, you should only select it if it's critical to verify that existence of such columns before the tasks starts.
The Generating Statements for Task: Data Mart Name window opens. Wait for the "Generating Statement for Data Mart No. <number> finished successfully." message to be displayed and then click Close.
-
-
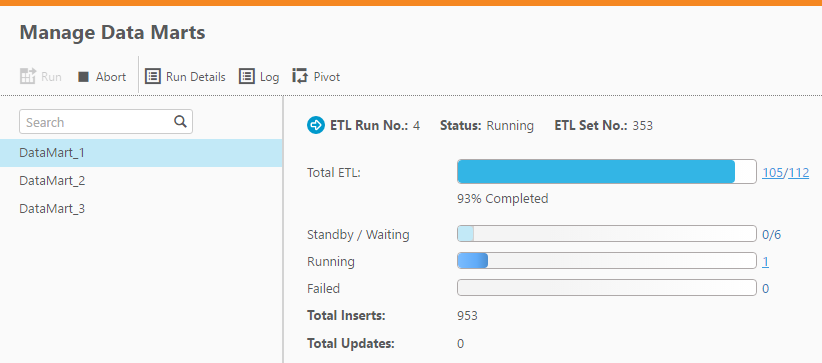
Click the Run toolbar button. The window switches to Monitor view and a progress bar shows the current progress in terms of percentage.

When the Total ETL reaches 100 percent, data mart population is complete.
You can stop the task at any time by clicking the Abort toolbar button. This may be necessary if you need to urgently edit the task settings due to some unforeseen development. After editing the task settings, simply click the Run button again to restart the task.
Information note- Aborting a task may leave the data warehouse tables in an inconsistent state. Consistency will be restored the next time the task is run.
- In rare situations, the Monitor view in the Manage Data Marts window may not show any tasks initially. To remedy this, refresh the browser window.
Other monitoring information such as the run details (i.e. the number of rows inserted/updated) and the task log files can be accessed by clicking the Run Details and Log buttons respectively.
Should any errors occur, you can click the link at the end of the Failed bar for additional information that may help you troubleshoot the problem.
Once your data mart has been loaded with data, you can check that the required data is available for your BI tools. For more information, see Displaying data in a pivot table.
