Monitoring visualizations in Qlik Cloud
In this video, you’ll learn how to monitor visualizations in Qlik Cloud using the Activity Center, making it easy to keep track of key insights without opening any apps.
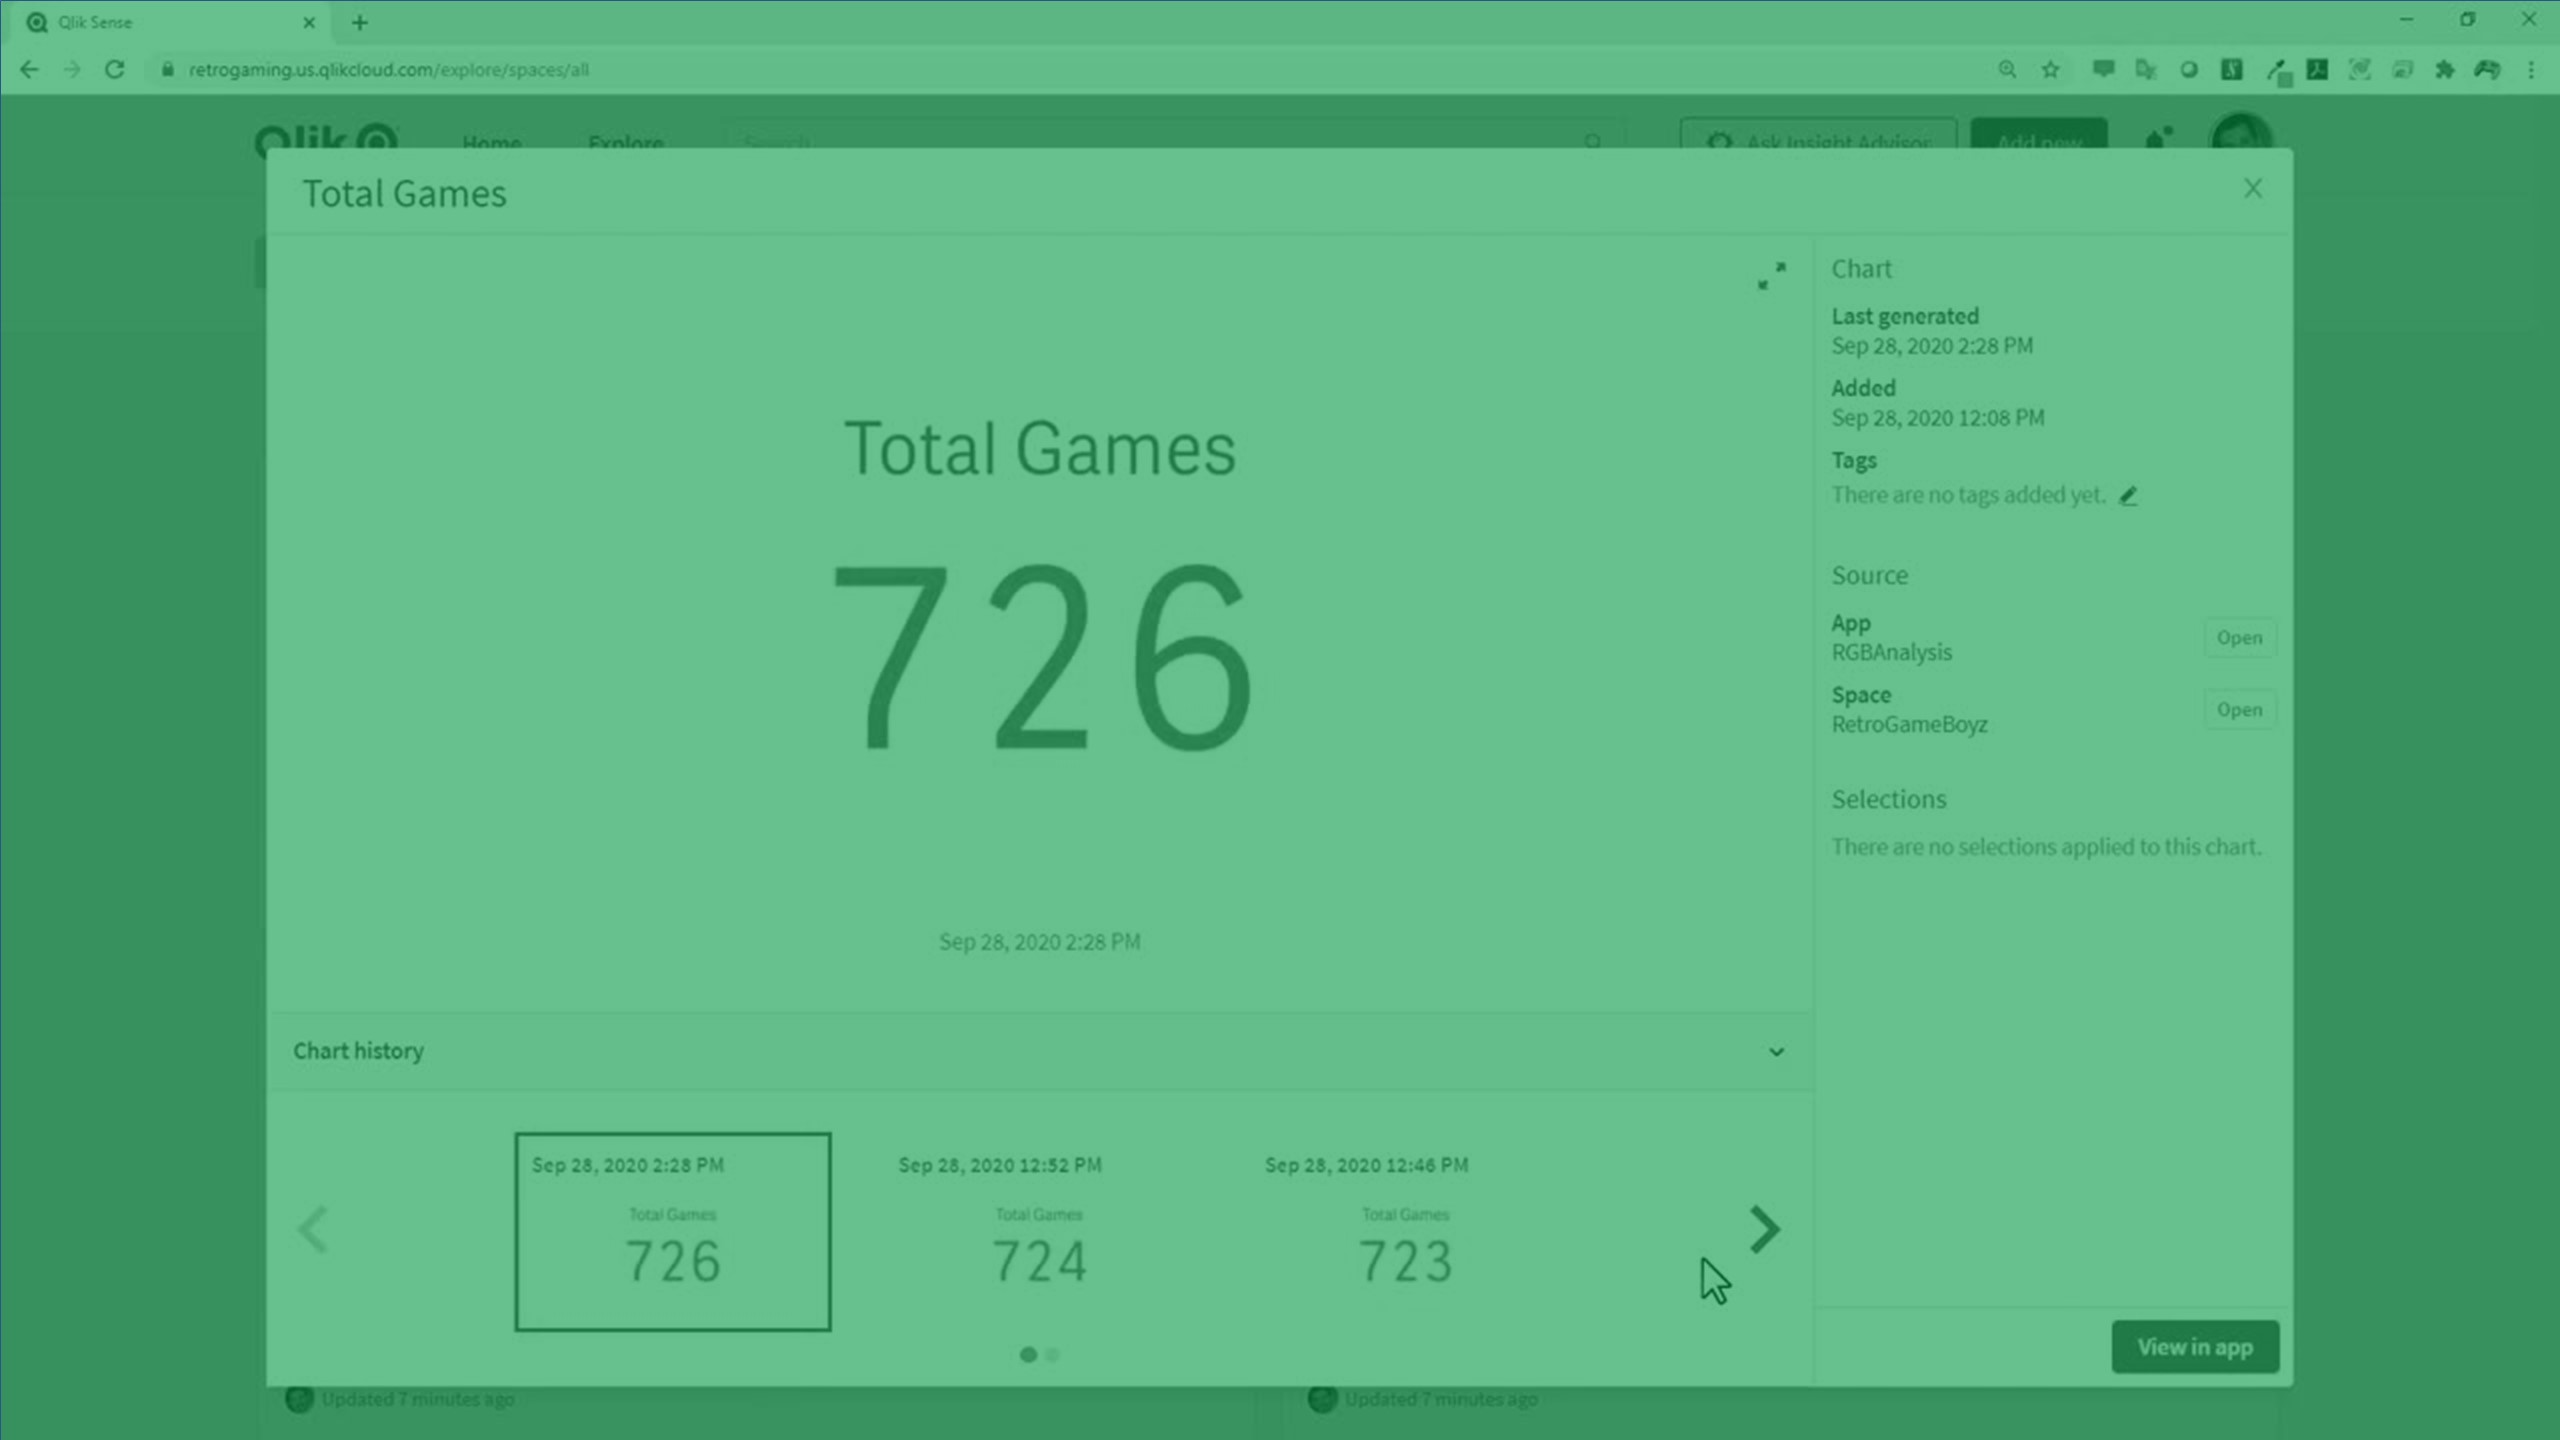
We walk through how to enable monitoring, fix the chart view, add metadata, understand how selections behave, and explore version history as your data reloads over time.
You’ll also see where monitored charts appear, how they automatically refresh with each reload, and how to open the visualization directly in the source app with selections applied.
A quick and efficient way to stay on top of the metrics that matter most.