Skip to main content Skip to complementary content

Finalizing and executing the column analysis

After defining the columns to be analyzed and setting the indicators, you may want to filter the data that you want to analyze and decide what engine to use to execute the column analysis.

Before you begin

  • The column analysis is open in the analysis editor.
  • You have set system or predefined indicators for the column analysis.
  • You have installed in Talend Studio the SQL explorer libraries that are required for data quality.

Procedure

  1. In the Data Filter view, enter an SQL WHERE clause to filter the data on which to run the analysis, if required.
  2. In the Analysis Parameters View, do the following:
    1. In the Number of connections per analysis field, set the number of concurrent connections allowed per analysis to the selected database connection.
      You can set this number according to the database available resources, that is the number of concurrent connections each database can support.
      Information noteNote: Connection concurrency is not supported when using a connection to a SQLite database or a Hive database on Spark. Connection concurrency is supported when using a connection to a Hive2 server.
    2. From the Execution engine list, select the engine, Java, or SQL, you want to use to execute the analysis.
      If you select the Java engine:
      • Select the Allow drill down check box to be able to drill down the results of all indicators in the Analysis Results view. It does not apply to the Row Count indicator.
      • In the Max number of rows kept per indicator field, set the number of the data rows you want to drill down.
  3. If you have defined context variables in the Context view in the analysis editor, do the following:
    1. use the Data Filter and Analysis Parameter views to set/select context variables to filter data and to decide the number of concurrent connections per analysis respectively.
    2. In the Context Settings view, select from the list the context environment you want to use to run the analysis.
  4. Save the analysis and press F6 to execute it.
    The editor switches to the Analysis Results view.
    When you use the SQL engine, the analysis runs multiple indicators in parallel and results are refreshed in the charts while the analysis is still in progress.
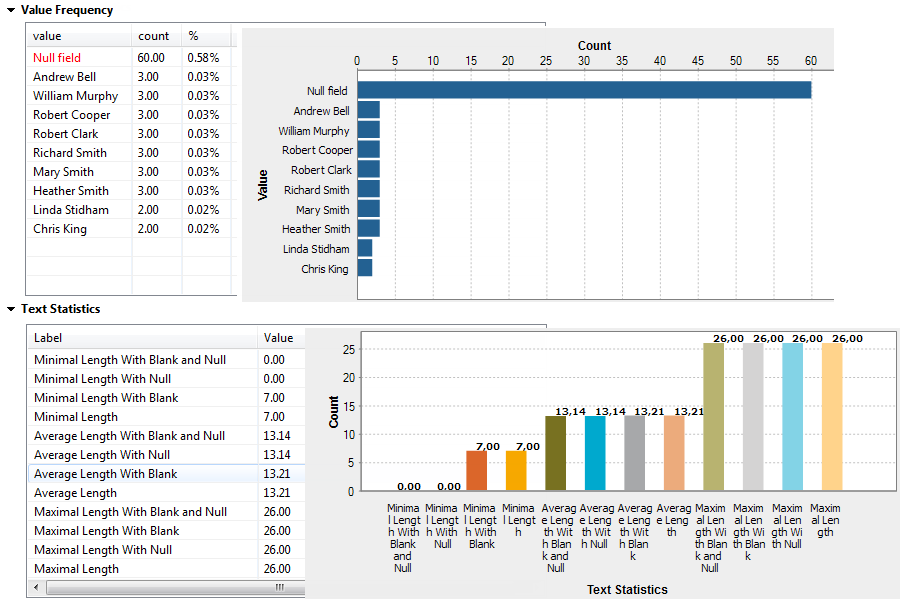
    Below are the graphics representing the Frequency and Text Statistics for the fullname column.
    Graphical results in the Value Frequency and Text Statistics sections.
    For further information about the Frequency and Text Statistics, see Advanced statistics and Text statistics respectively.
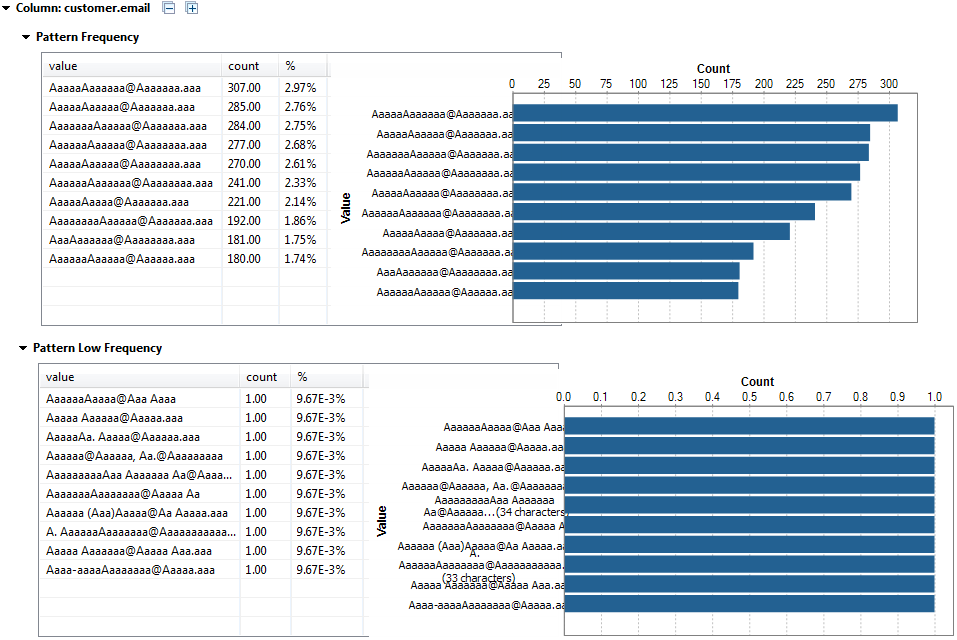
    Below are the graphics representing the Pattern Frequency and Pattern Low Frequency statistics for the email column.
    Graphical results in the Pattern Frequency and Pattern Low Frequency sections.
    The patterns in the table use a and A to represent the email values. Each pattern can have till 30 characters. If the total number of characters exceeds 30, the pattern is represented as the following: aaaaaAAAAAaaaaaAAAAAaaaaaAAAAA...<total number of characters>, and you can place your pointer on the pattern in the table to get the original value.
    For further information about these indicators, see Pattern frequency statistics.
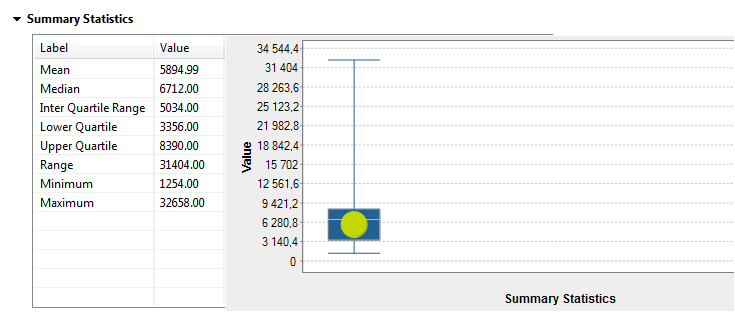
    Below are the graphics representing the Summary Statistics for the total_sales column.
    Graphical results in the Summary Statistics section.
    For further information about these indicators, see Summary statistics.
    Below are the graphics representing the Benford's law statistics for the total_sales column.
    Graphical results in the Benford Law section.
    For further information about the Benford's law statistics usually used as an indicator of accounting and expenses fraud in lists or tables, see Fraud Detection.

Results

If you execute this analysis using the Java engine and then select the Allow drill down check box in the Analysis parameters view, you can store locally the analyzed data and thus access it via Analysis Results > Data view . You can use the Max number of rows kept per indicator field to decide the number of the data rows you want to make accessible.

When you select the Java engine, the system will look for Java regular expressions first, if none is found, it looks for SQL regular expressions.

If you execute this analysis using the SQL engine, you can view the executed query for each of the attached indicators if you right-click an indicator and then select the View executed query option from the list. However, when you use the Java engine, SQL queries will not be accessible and thus clicking this option will open a warning message.
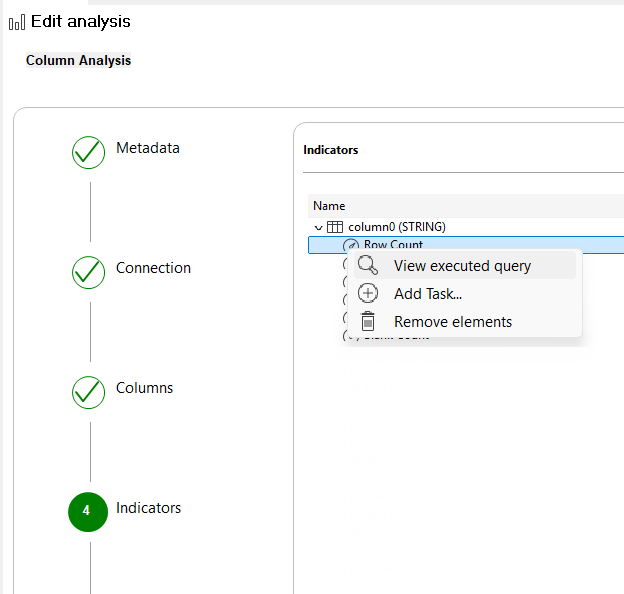
Contextual menu of a column in the Analyzed Columns section.

For more information on the Java engine, see Using the Java or the SQL engine.

Did this page help you?

If you find any issues with this page or its content – a typo, a missing step, or a technical error – please let us know!