
Finalizing and executing the column analysis
After defining the columns to be analyzed and setting the indicators, you may
want to filter the data that you want to analyze and decide what engine to use to execute
the column analysis.
Before you begin
- The column analysis is open in the analysis editor.
- You have set system or predefined indicators for the column analysis.
- You have installed in Talend Studio the SQL explorer libraries that are required for data quality.
Procedure
-
Save the analysis and press F6 to execute it.
The editor switches to the Analysis Results view.When you use the SQL engine, the analysis runs multiple indicators in parallel and results are refreshed in the charts while the analysis is still in progress.Below are the graphics representing the Frequency and Text Statistics for the fullname column.
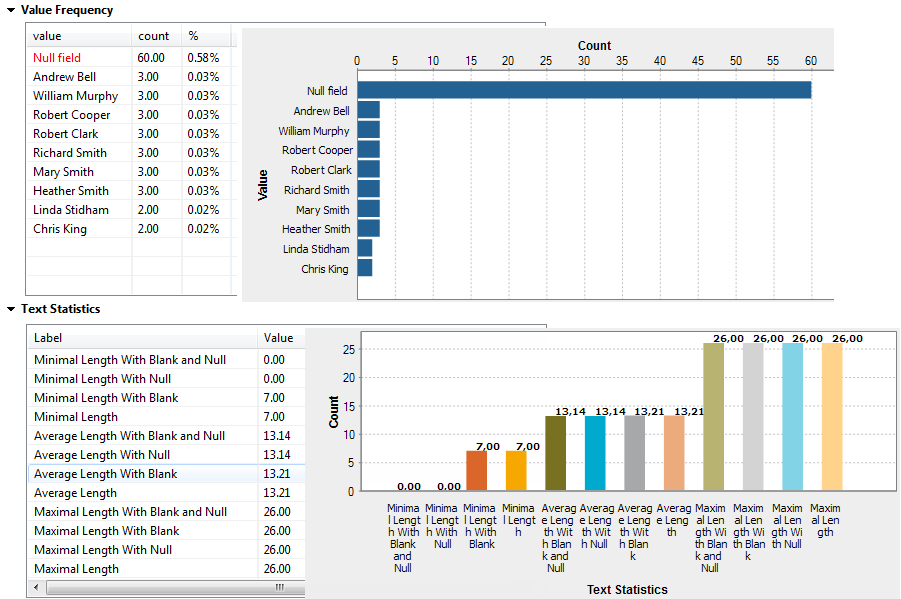 For further information about the Frequency and Text Statistics, see Advanced statistics and Text statistics respectively.Below are the graphics representing the Pattern Frequency and Pattern Low Frequency statistics for the email column.
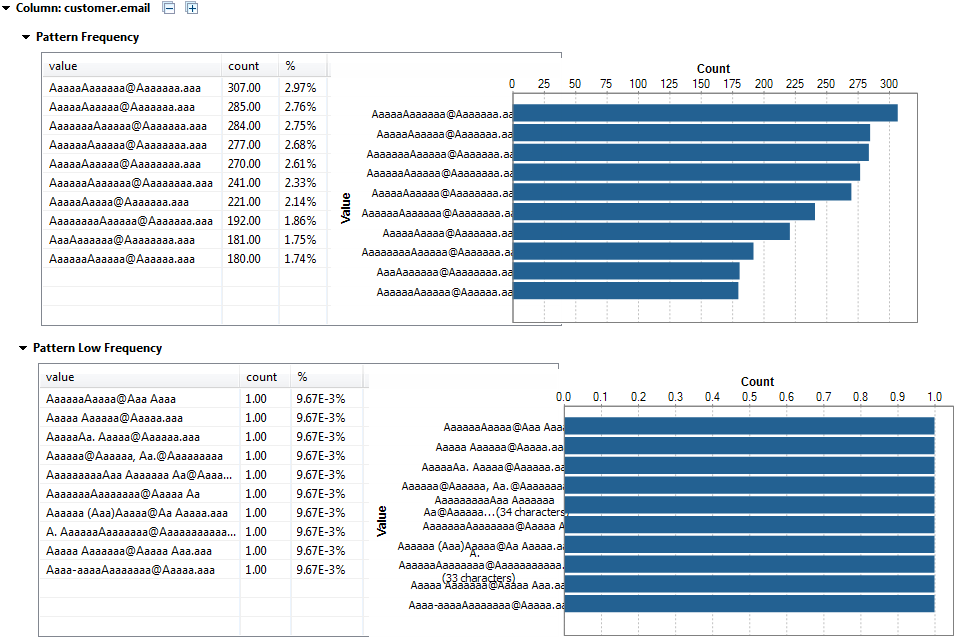 The patterns in the table use a and A to represent the email values. Each pattern can have till 30 characters. If the total number of characters exceeds 30, the pattern is represented as the following: aaaaaAAAAAaaaaaAAAAAaaaaaAAAAA...<total number of characters>, and you can place your pointer on the pattern in the table to get the original value.For further information about these indicators, see Pattern frequency statistics.Below are the graphics representing the Summary Statistics for the total_sales column.
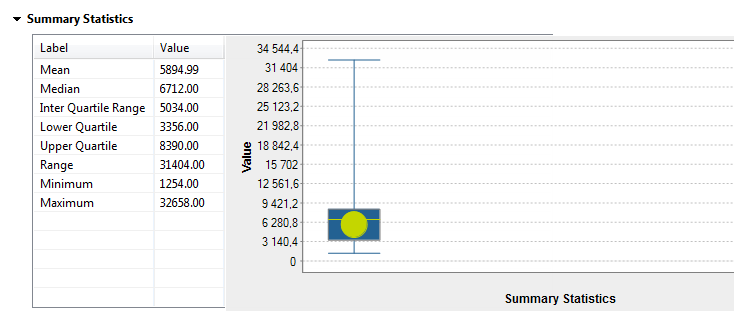 For further information about these indicators, see Summary statistics.Below are the graphics representing the Benford's law statistics for the total_sales column.
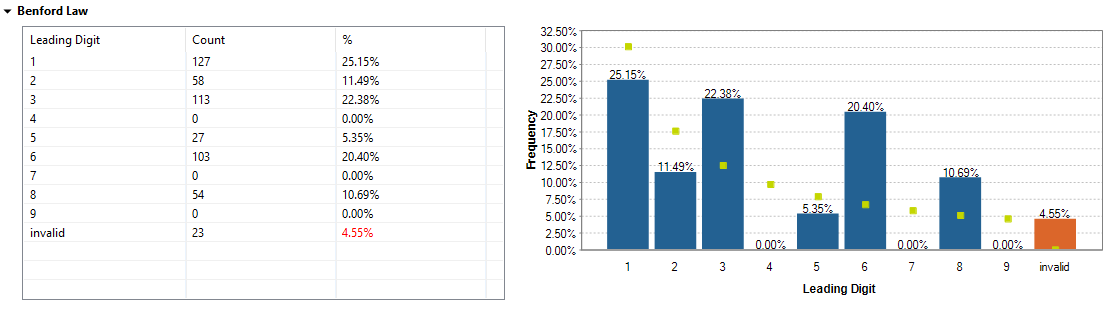 For further information about the Benford's law statistics usually used as an indicator of accounting and expenses fraud in lists or tables, see Fraud Detection.
Results
When you select the Java engine, the system will look for Java regular expressions first, if none is found, it looks for SQL regular expressions.
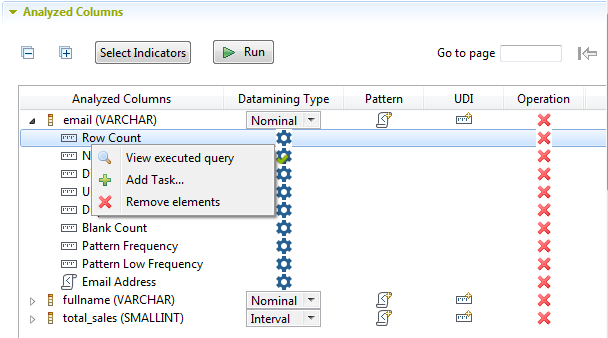
If you execute this analysis using the SQL engine, you can view the executed query for each of the attached indicators if you right-click an indicator and then select the View executed query option from the list. However, when you use the Java engine, SQL queries will not be accessible and thus clicking this option will open a warning message.
For more information on the Java engine, see Using the Java or the SQL engine.