Area Layer
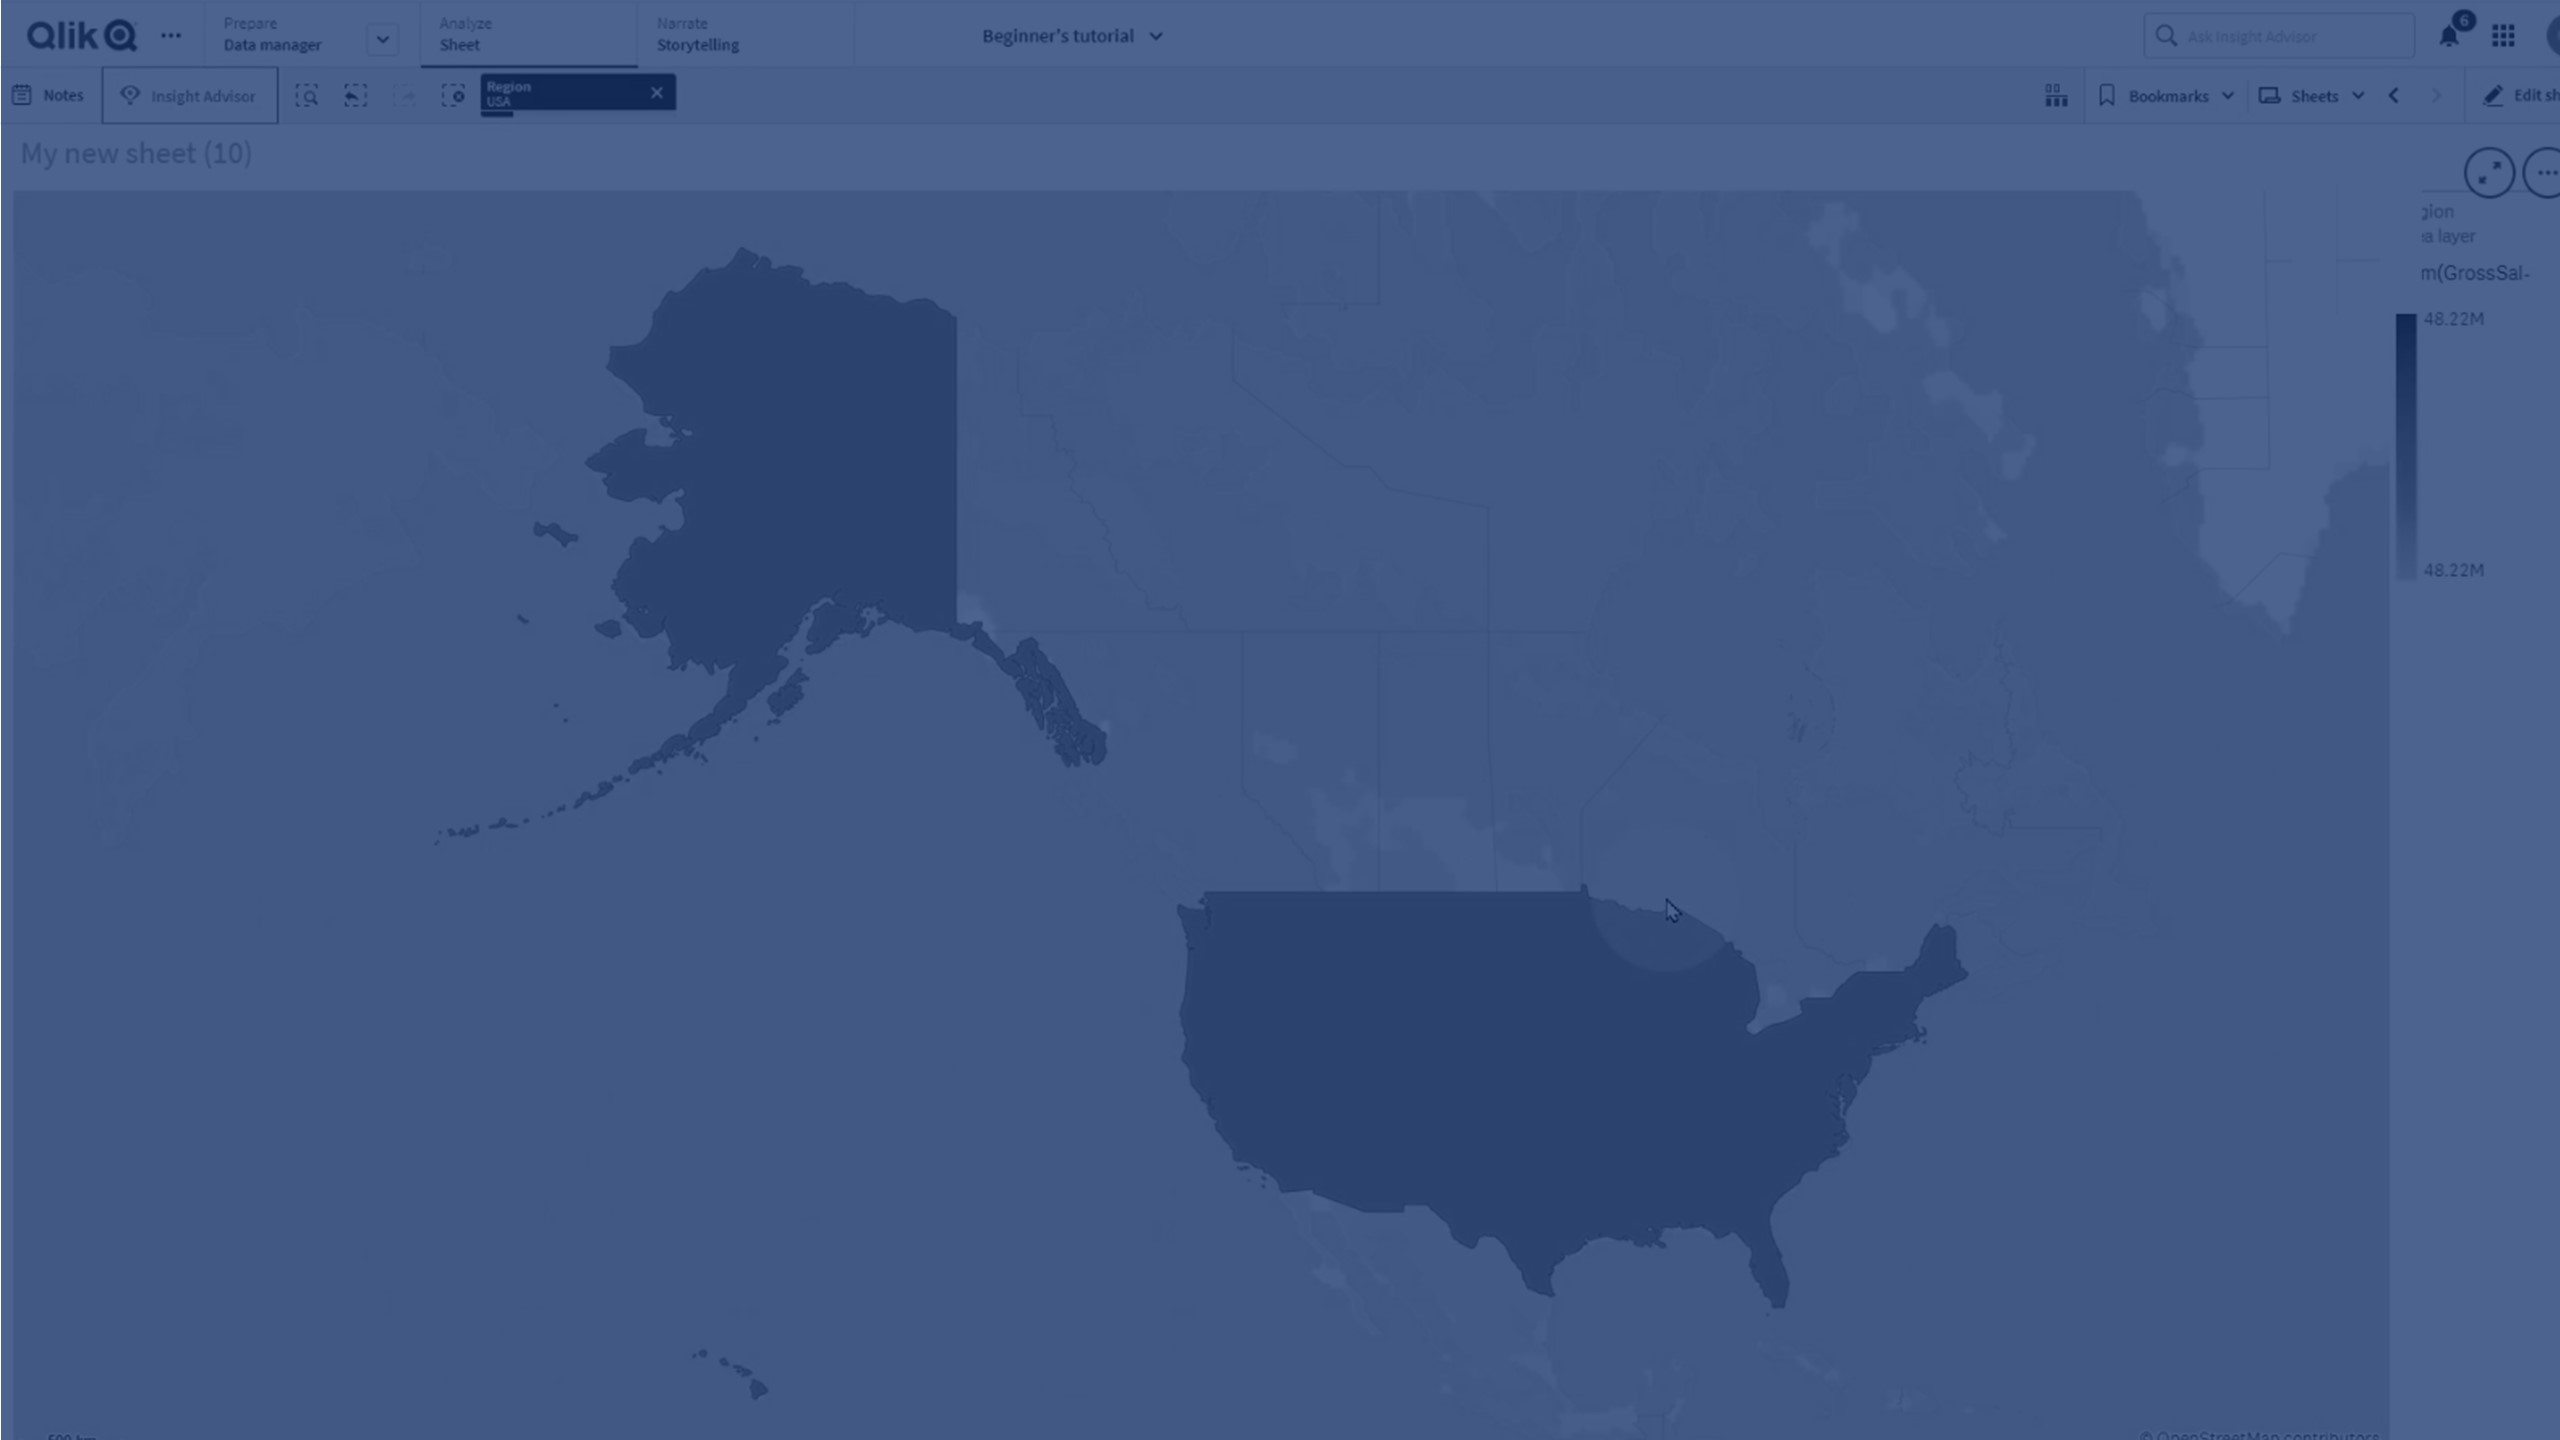
In this tutorial, you’ll learn how to use the Area Layer in Qlik Sense maps to visualize geographic regions such as countries, states, or custom areas using polygon geometry.
You’ll discover how to:
- Add an Area Layer to a map visualization
- Use a dimension field (e.g., region) for geographic areas
- Apply colors by measure (e.g., Gross Sales)
- Enhance insights by comparing measure values across areas
This video is ideal for Qlik Sense users who want to build geo-analytics dashboards with impactful map visualizations.
🌍 00:01 – Introduction: What is an Area Layer
🗺️ 00:09 – Understanding Area Layers with Polygon Geometry
➕ 00:23 – Creating a Map and Adding an Area Layer
📊 00:49 – Selecting Dimensions (Region Field Example)
🎨 01:05 – Coloring by Measure (Sum of Gross Sales)
✨ 01:12 – Using Colors to Present Measure Values
🏁 01:23 – Conclusion