Trellis Container
In this tutorial, we walk you through the process of working with the Trellis container extension, demonstrating how to generate a grid of identical charts based on a master visualization. Learn how to effectively utilize this functionality to gain valuable insights and make informed decisions in your data analysis endeavors.
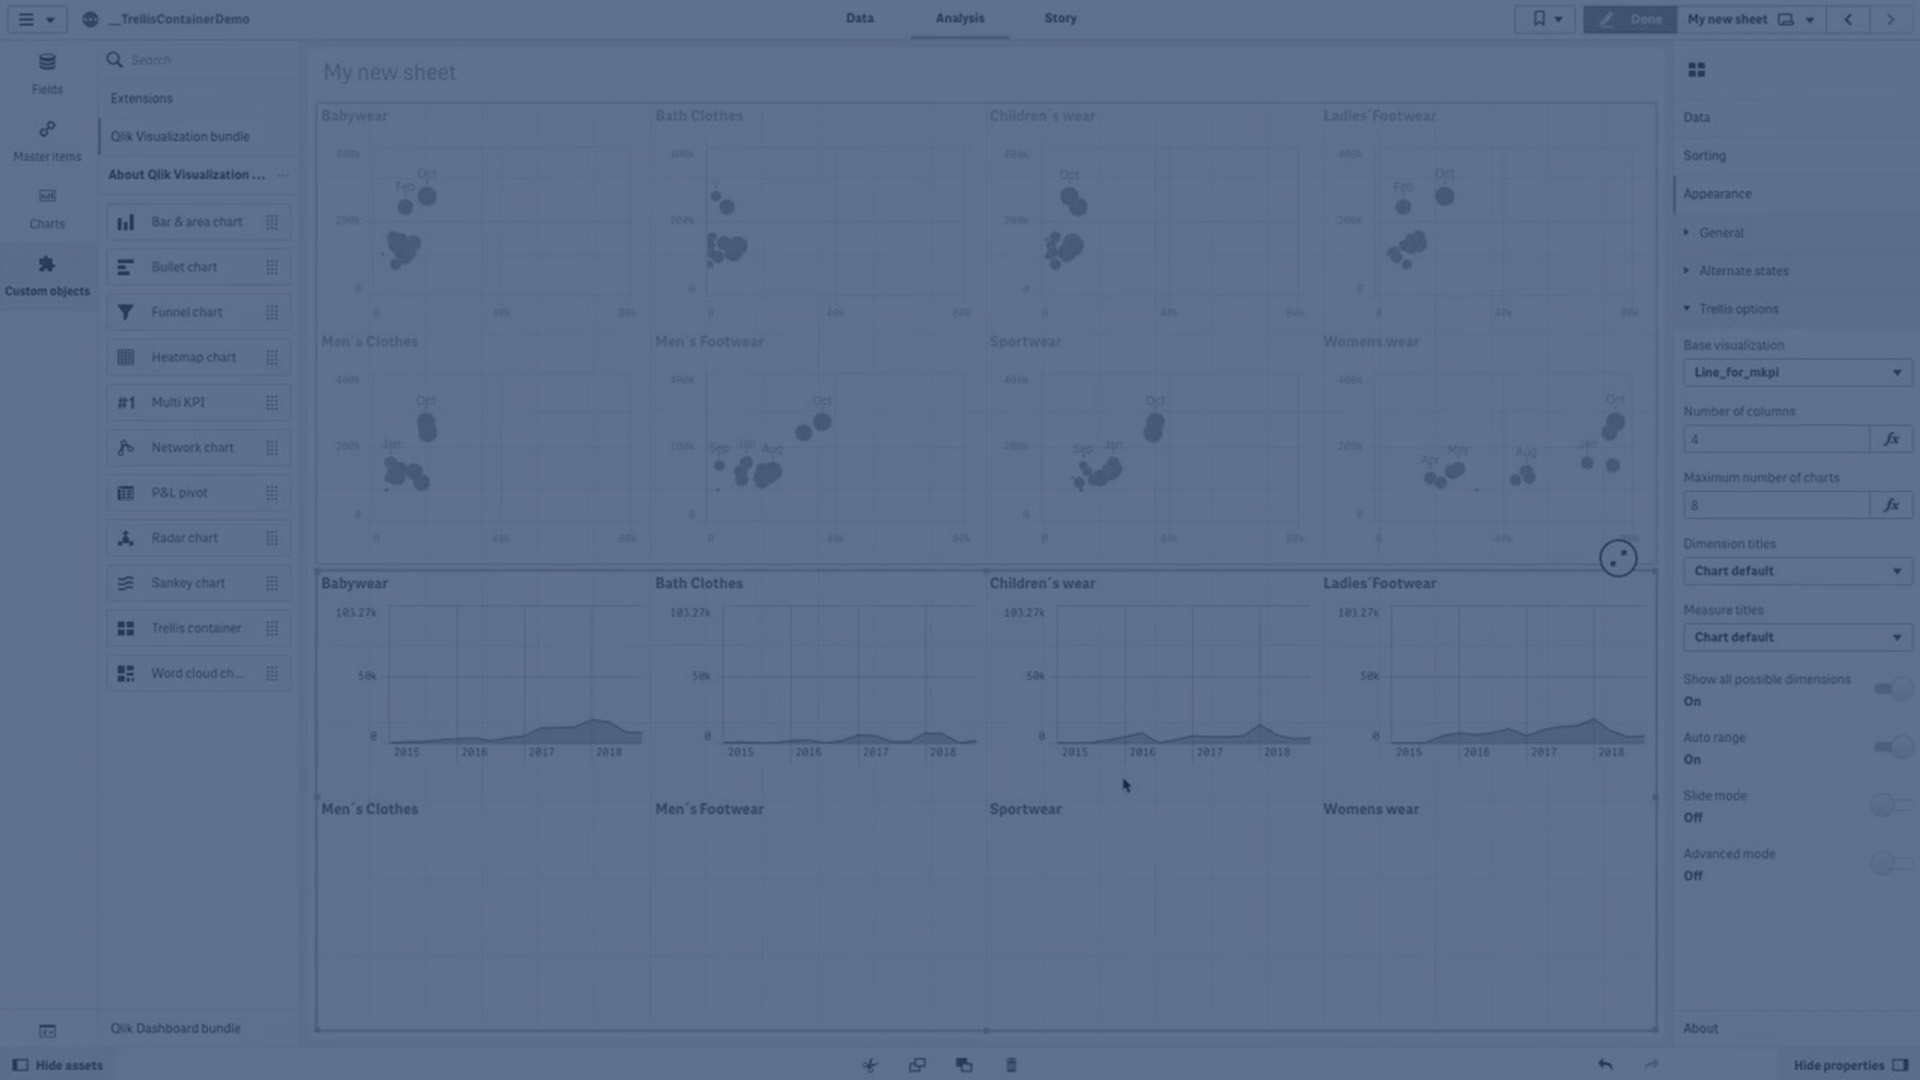
The trellis chart shows a grid of the same chart for different dimension values. You can use the trellis chart to compare metrics for different groups of data.