
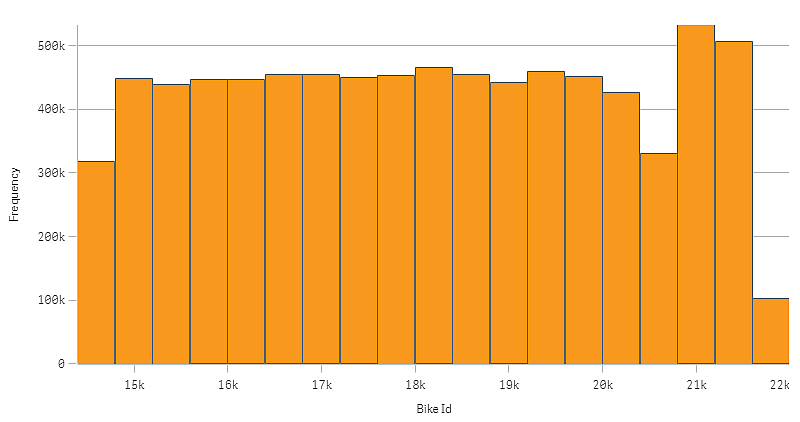
The histogram is suitable for visualizing distribution of numerical data over a continuous interval, or a certain time period. The data is divided into bins, and each bar in a histogram represents the tabulated frequency at each bin.
Number of dimensions and measures
You can only apply a single dimension to a histogram. The dimension must be a numerical field. Histograms do not need a measure, as the frequency of the binned data is automatically calculated.
Information noteYou cannot use a master dimension that was created using the expression editor, even if the resulting field is numeric.