
Description
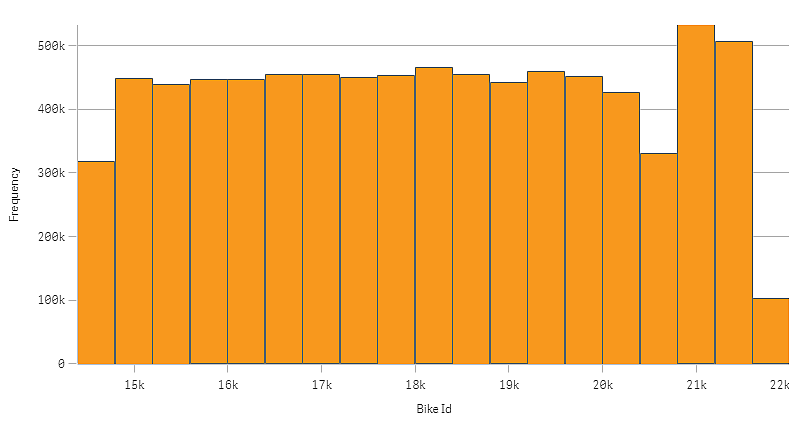
You can include a single dimension in a histogram. The data is divided into bins, and each bar in a histogram represents the tabulated frequency at each bin. Histograms do not need a measure, as the frequency of the binned data is automatically calculated.
When to use it
The histogram is suitable for visualizing distribution of numerical data over a continuous interval, or a certain time period.
Advantages
The histogram organizes large amounts of data, and produces a visualization quickly, using a single dimension.
Disadvantages
The histogram is not relevant for detailed analysis of the data as it deals with a summary of the data distribution.