
Description
You can include up to two dimensions and one measure in a box plot.
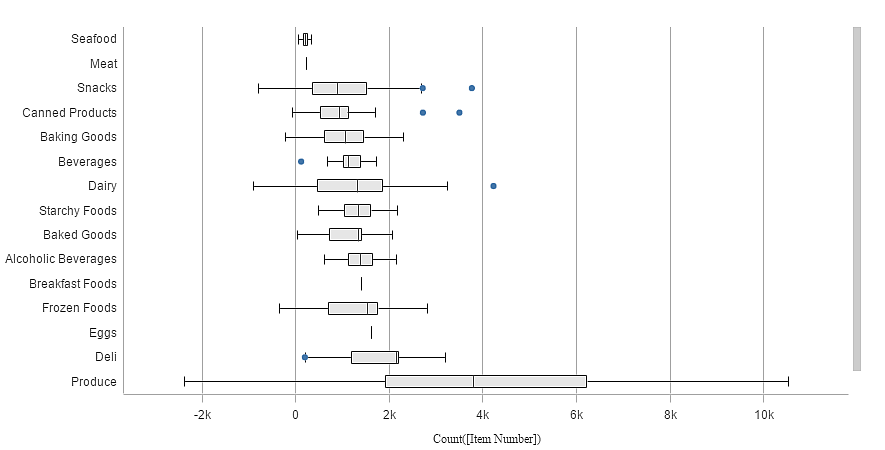
Each box corresponds to a value of the second dimension, and the distribution of the values of the measure determines the length of the boxes and whiskers. A stretched box with long whiskers represent a high distribution of values, while a compressed box represents low distribution of values.
The bar chart can be horizontal or vertical.
When to use it
The box plot is suitable for comparing range and distribution for groups of numerical data.
Advantages
The box plot organizes large amounts of data, and visualizes outlier values.
Disadvantages
The box plot is not relevant for detailed analysis of the data as it deals with a summary of the data distribution.