With global grouping you use a limited data set, and in that data set, you single out values that you want to focus on, for example, the best quarters, the top sales persons, or the worst selling products.
You can regard global grouping as a two-step procedure. First you apply a limitation to a data set, and then, in the resulting list, you apply the same limitation again to the inner dimension (that is, the dimension that is second in the sorting hierarchy), to only show results for the singled out inner dimension values.
Example:
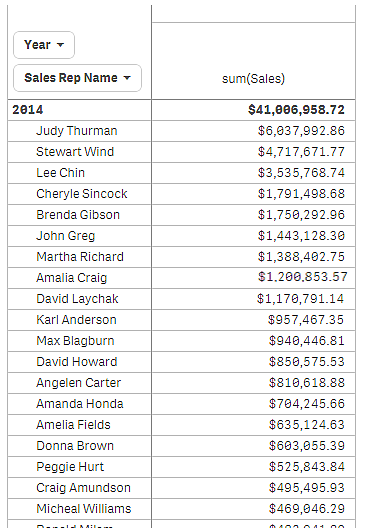
In the following pivot table, no limitation is applied. The values are sorted on Sales, descending. The list is long, the values for 2013 are not shown.
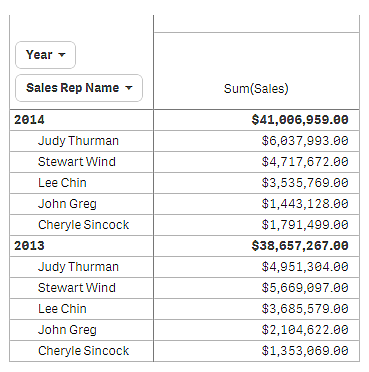
In the following pivot table, a limitation has been applied to the (inner) dimension Sales Rep Name, so that only the top five sales representatives for the years 2013 and 2014 are shown.
The next step is to select global grouping in the properties panel. The option Global grouping is only available when you have applied a limitation on the dimension.
When global grouping is selected, the limitation of the top five sales representatives is applied again, but this time regardless of the dimension Year. The five sales representatives with the highest sales (either in 2013 or 2014) are the only ones that will be presented in the final pivot table.
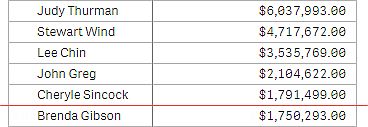
The following image shows the six highest results for 2014 and 2013. The top four results are from 2014, but the fifth (John Greg) is from 2013. Because five other sales representatives have higher sales than Brenda Gibson (who was number five in 2014), she is knocked out of the list.
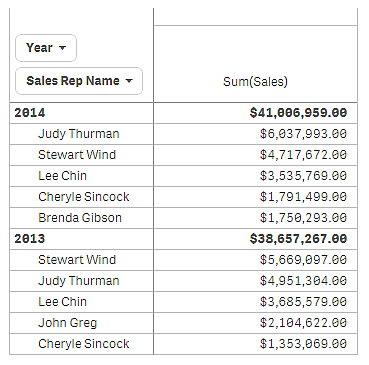
The following image shows the pivot table with global grouping applied. The pivot table only contains the sales results for the top five sales representatives. Even though Brenda Gibson had a better result in 2014 than John Greg, his result for 2013 qualified him for the top five list.