Range selection
Last updated: 10/5/2025
You draw your selections, either on the y-axis or the x-axis. For an axis showing measure values, you are also able to click on the range bubble to enter a specific numeric value.
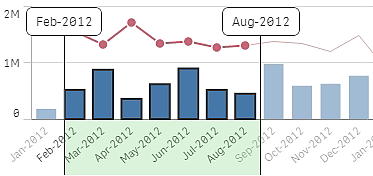
Bar chart example
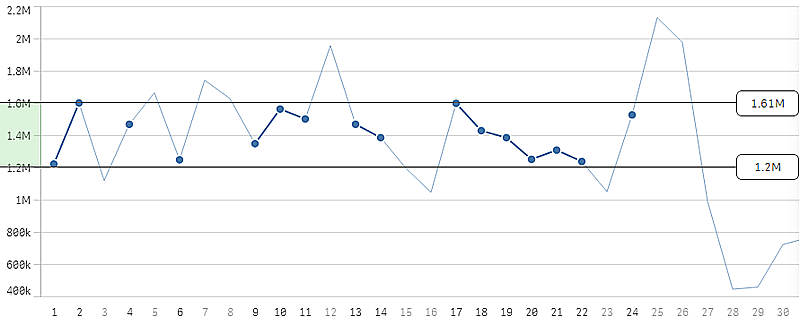
Line chart example
