
Description
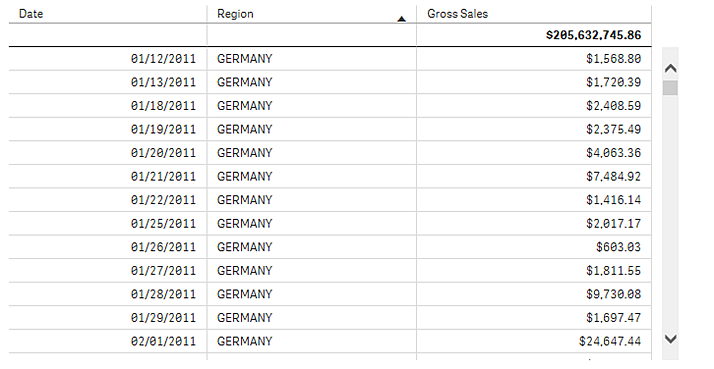
The table displays values in record form, so that each row of the table contains fields calculated using measures. Typically, a table includes one dimension and multiple measures.
When to use it
Use a table, when you want to view precise values rather than visualizations of values, and when you want to compare individual values to each other. A table is particularly useful when drill-down groups are used as a dimension.
Advantages
You can sort the table in different ways. Many values can be included in a table, and when you drill down in a table, you make good use of a limited space of the sheet. A table is excellent when you want to see exact values rather than trends or patterns.
Disadvantages
If the table contains many values, it is difficult to get an overview of how values are related and of trends. It is also difficult to identify an irregularity within the table.