
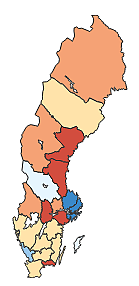
Maps can be used for a wide variety of purposes. A common use in business intelligence is to plot sales data per region or per store.
You can create a map by using either a point layer or an area layer. If you use a point layer, you also need a background map to provide the context for the points, otherwise you will only have a collection of points on an empty background. You can add a measure value or an expression to the dimension values, and use the size of the points or color by measure to reflect the size of the measure. If you use an area layer, you often do not need a background map, but there is support for complementing an area layer with a background.
The background map is of the type 'slippy map' in which you can zoom, pan around, and make selections.
See also: http://wiki.openstreetmap.org/wiki/Slippy_Map
Loading data
You can load map data from .kml files and Excel files. You load the data, either through the quick data load or the data connection. By default, all fields are selected in the data selection dialog, even if they do not contain any data. A .kml file could contain, for example, area data but no point data. Although there is nothing wrong with loading empty fields, it can be inconvenient to have empty fields when you are working with the map visualization. Adding a dimension without any data to a map will not generate any visual output and could confuse a user. Therefore, you should clear the selections of all empty data fields in the data selection dialog, before you load the data.
Creating a map from data in a .kml file
Normally, a .kml file contains point data, area data, or both. In the following screenshot, from the data selection dialog, you can see that the selection of the field FloridaCounties.Point has been cleared because the field does not contain any data. By clearing the field you will not run the risk of creating map dimensions without any data.
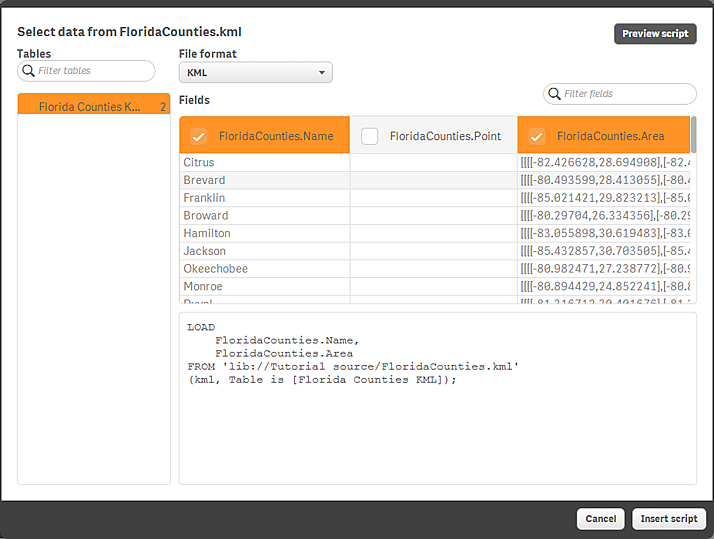
When you click Insert script, the following script is generated:
If the selection of the empty field had not been cleared, the script would also have contained the following string:
When you run the script and add a map chart to the sheet, you can add either FloridaCounties.Area (area) or FloridaCounties.Name (area) as a dimension.
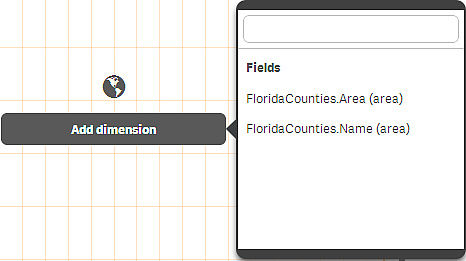
Although you will get the same visual result with either of the fields (a map with the counties), there will be a difference when you hover over a county. If you select FloridaCounties.Name (area), the name of the county is shown as a tooltip, and if you select FloridaCounties.Area (area)the area data is shown. The name of the county is undoubtedly more interesting. In addition, loading the field FloridaCounties.Area is much slower than loading the field FloridaCounties.Name.
Optionally, you can also add a measure and use coloring by measure to reflect the difference in measure value between the different counties.
Creating a map from point data in an Excel file
You can create a map by using point data (coordinates) from an Excel file.
Point data formats
Point data can be read from Excel files. Two formats are supported:
- One format where the point data is stored in one column. Each point is specified as an array of x and y coordinates: '[x, y]'. With geographical coordinates, this would correspond to '[longitude, latitude]'. When using this format, you need to tag the point data field with $geopoint;.
- One format where the point data is stored in two columns, one for latitude and one for longitude. The function GeoMakePoint() can generate a point based on this format.
In the following examples we assume that the files contain the same data about the location of a company's offices, but in two different formats.
Example 1:
The Excel file has the following content for each office:
- City
- Location
- Number of employees
The load script could look as follows:
The field Location contains the point data and it is necessary to tag the field with $geopoint; so that it is recognized as a point data field. Add the following string after the last string in the LOAD command:
The complete script then looks as follows:
Run the script and create a map visualization. Add the point dimension to your map and provide a context by setting a background.
Example 2:
The Excel file has the following content for each office:
- City
- Latitude
- Longitude
- Number of employees
The load script could look as follows:
With the data in the fields Latitude and Longitude, you define a new field for the points. Add the following string above the LOAD command:
LOAD *, GeoMakePoint(Latitude, Longitude) as Location;
The function GeoMakePoint() joins the longitude and latitude data together.
The complete script then is as follows:
Run the script and create a map visualization. Add the point dimension to your map and provide a context by setting a background.
Number of points
For performance reasons, there is a limit to the number of points that can be displayed. By making selections, you can reduce the amount of data to display.
Adding a background map
If , for example, you have added a point layer with the major cities in the world, you normally want to have a background map to show the context.
Do the following:
-
In the toolbar, click Edit.
-
In the properties panel to the right, click Background.
-
Click the Show button.
The button is set to On.
-
From the list below, copy a URL and paste it in the URL text box.
-
From the list below, copy the attribution string that corresponds to the URL and paste the string in the Attribution box.
Slippy map servers
| Name | URL | Attribution string |
|---|---|---|
| OpenStreetMap | http://tile.openstreetmap.org/${z}/${x}/${y}.png | © <a href='http://www.openstreetmap.org/copyright' target='_blank'>OpenStreetMap</a> contributors |
| OpenCycleMap | http://a.tile.opencyclemap.org/cycle/${z}/${x}/${y}.png http://b.tile.opencyclemap.org/cycle/${z}/${x}/${y}.png http://c.tile.opencyclemap.org/cycle/${z}/${x}/${y}.png |
© <a href='http://www.opencyclemap.org/' target='_blank'>OpenCycleMap</a>.
Map data © <a href='http://www.openstreetmap.org/copyright' target='_blank'>OpenStreetMap</a> contributors |
| MapQuest OSM | http://otile1.mqcdn.com/tiles/1.0.0/map/${z}/${x}/${y}.png http://otile2.mqcdn.com/tiles/1.0.0/map/${z}/${x}/${y}.png http://otile3.mqcdn.com/tiles/1.0.0/map/${z}/${x}/${y}.png http://otile4.mqcdn.com/tiles/1.0.0/map/${z}/${x}/${y}.png | Data, imagery and map information provided by <a href='http://www.mapquest.com/' target='_blank'>MapQuest</a>, <a href='http://www.openstreetmap.org/' target='_blank'>OpenStreetMap</a> and contributors, <a href='http://creativecommons.org/licenses/by-sa/2.0/' target='_blank'>CC-BY-SA</a> <img src='http://developer.mapquest.com/content/osm/mq_logo.png' border='0'> |
| MapQuest Open Aerial | http://otile1.mqcdn.com/tiles/1.0.0/sat/${z}/${x}/${y}.png http://otile2.mqcdn.com/tiles/1.0.0/sat/${z}/${x}/${y}.png http://otile3.mqcdn.com/tiles/1.0.0/sat/${z}/${x}/${y}.png http://otile4.mqcdn.com/tiles/1.0.0/sat/${z}/${x}/${y}.png | Tiles Courtesy of <a href='http://open.mapquest.co.uk/' target='_blank'>MapQuest</a>. Portions Courtesy NASA/JPL-Caltech and U.S. Depart. of Agriculture, Farm Service Agency. <img src='http://developer.mapquest.com/content/osm/mq_logo.png' border='0'> |
| MapBox Natural Earth (support only first 5 zoom levels) | http://a.tiles.mapbox.com/v3/mapbox.natural-earth-hypso-bathy/${z}/${x}/${y}.png http://b.tiles.mapbox.com/v3/mapbox.natural-earth-hypso-bathy/${z}/${x}/${y}.png http://c.tiles.mapbox.com/v3/mapbox.natural-earth-hypso-bathy/${z}/${x}/${y}.png http://d.tiles.mapbox.com/v3/mapbox.natural-earth-hypso-bathy/${z}/${x}/${y}.png | Tiles © <a href='http://mapbox.com/'>MapBox</a> |
Number of dimensions and measures
You can only use one dimension type, point or area. In the dimension, you can create an expression. If you add a measure from the master items to the map, the measure is added in the expression box under Layers > <layer type> in the properties panel.
Zooming and panning
In a map, you have options for zooming and panning. The interaction differs depending on what device you are using. Sometimes when you zoom, you may experience that the zooming is partly stepwise. That happens when the background map is updated.
Touch device interaction
On a touch device you pinch apart to zoom and swipe to pan.
You can reset the zoom by tapping , which appears in the top-right corner when you start zooming.
Computer (mouse) interaction
With a computer, you use the mouse to zoom and pan in the visualization. Use the scroll wheel to zoom in and out. The zooming is made on the area where the pointer is. You pan around by dragging.
You can also use the navigation tool for zooming and panning. Right-click in the map and select Navigation to open the tool.
You reset the zoom by clicking the scroll wheel or by clicking in the navigation tool.