
When you analyze your data, you have different ways of making selections. In a bar chart you can either use click selection, draw selection, legend selection, lasso selection, range selection, or label selection. To confirm a selection, click or outside the visualization. You can also press Enter. To cancel, click or press Esc.
Click selection
You can select bars by clicking them, one at a time. To deselect a bar, click it.
Draw selection
You can draw one or more lines in the chart to select bars. All bars that are touched by a line are selected, all other bars are dimmed. To deselect a bar, click it.When you want to make a draw or lasso selection, you must first turn on lasso selection by clicking at the top of the visualization. On a computer you can also press Shift and make the selection.
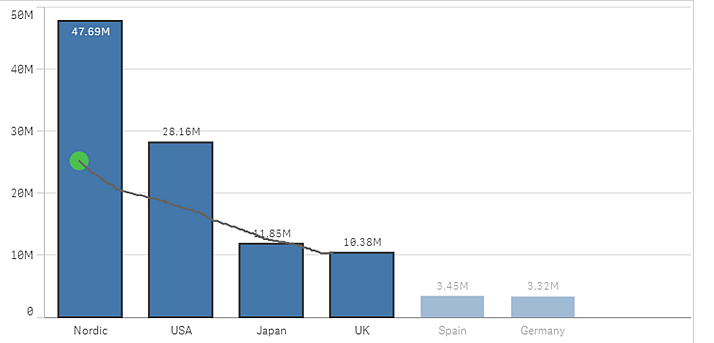
Lasso selection
In lasso selection, you can draw a lasso freehand to enclose an area. You must close the area properly by returning to the starting point of your selection.When you want to make a draw or lasso selection, you must first turn on lasso selection by clicking at the top of the visualization. On a computer you can also press Shift and make the selection.
Range selection
In range selection, you can make selections either on the x-axis or the y-axis, one at a time. Select a starting point along the axis, just outside the chart area, and drag to make a selection. As soon as you start dragging, a starting point line is displayed, as well as an end point line that shows the current selection. You can adjust your selection by dragging the lines, the value boxes, or the green selection area.
Label selection
You can click the dimension labels to make selections. When dimensions are grouped or stacked, the whole group or stack is selected.
Legend selection
There are two legend types: box legend, with one legend item per dimension value, and range legend, with a gradient scale, where all measure values are represented. In the box legend, you select and deselect the items one at a time by clicking them. In the range legend, you drag from a starting point to an end point to enclose an area. You cannot deselect a certain item, but you can change the range.
When you have a bar chart with two dimensions and one measure (either grouped or stacked), the selection is by value and not by group or by stack. This means that only parts of a group or stack are selected.
When you have a bar chart with one dimension and two measures (either grouped or stacked),selections cannot be made.