
You draw a freehand line to select several values/data points at a time. You cannot draw to deselect values/data points.
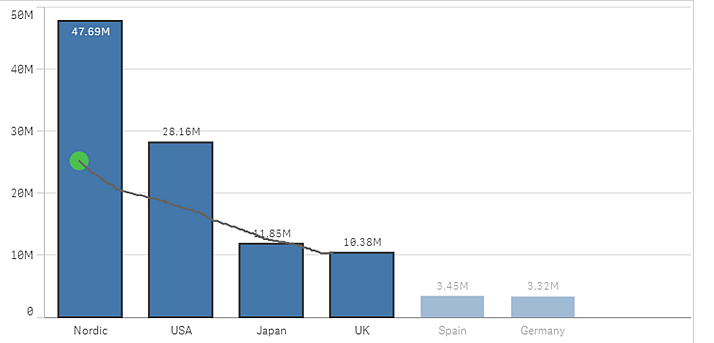
Bar chart example
In a table or a filter pane, you draw across several values to select them.

Filter pane example
In a line chart you draw along a line to select a number of data points.
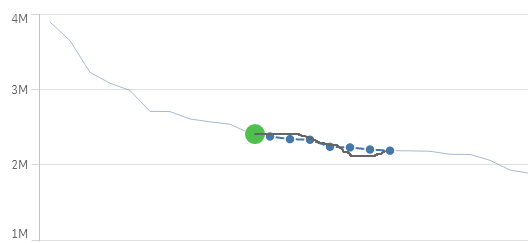
Line chart example
In a scatter plot you draw across a number of data points to select them.
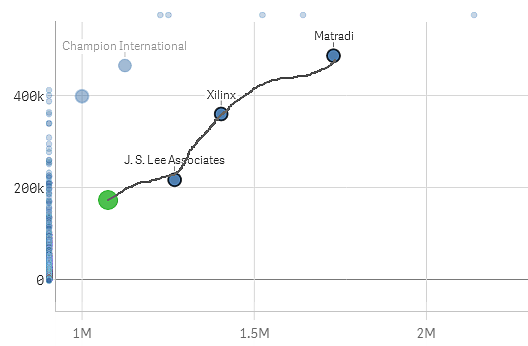
Scatter plot example