
Above() evaluates an expression at a row above the current row within a column segment in a table. The row for which it is calculated depends on the value of offset, if present, the default being the row directly above. For charts other than tables, Above() evaluates for the row above the current row in the chart's straight table equivalent.
Syntax:
Above([TOTAL] expr [ , offset [,count]])
Return data type: dual
Arguments:
| Argument | Description |
|---|---|
| expr | The expression or field containing the data to be measured. |
| offset |
Specifying an offsetn, greater than 1 moves the evaluation of the expression n rows further up from the current row. Specifying an offset of 0 will evaluate the expression on the current row. Specifying a negative offset number makes the Above function work like the Below function with the corresponding positive offset number. |
| count |
By specifying a third parameter count greater than 1, the function will return a range of count values, one for each of count table rows counting upwards from the original cell. In this form, the function can be used as an argument to any of the special range functions. Range functions |
| TOTAL |
If the table is one-dimensional or if the qualifier TOTAL is used as argument, the current column segment is always equal to the entire column. See also: Defining the aggregation scope |
On the first row of a column segment, a NULL value is returned, as there is no row above it.
Limitations:
Recursive calls will return NULL.
Examples and results:
Example 1:
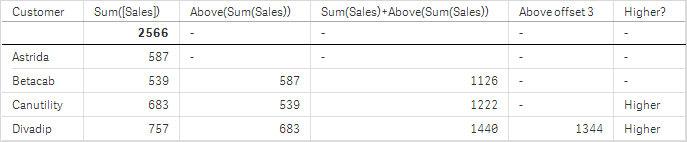
In the screenshot of the table shown in this example, the table visualization is created from the dimension Customer and the measures: Sum(Sales) and Above(Sum(Sales)).
The column Above(Sum(Sales)) returns NULL for the Customer row containing Astrida, because there is no row above it. The result for the row Betacab shows the value of Sum(Sales) for Astrida, the result for Canutility shows the value for Sum(Sales) for Betacab, and so on.
For the column labeled Sum(Sales)+Above(Sum(Sales)), the row for Betacab shows the result of the addition of the Sum(Sales) values for the rows Betacab + Astrida (539+587). The result for the row Canutility shows the result of the addition of Sum(Sales) values for Canutility + Betacab (683+539).
The measure labeled Above offset 3 created using the expression Sum(Sales)+Above(Sum(Sales), 3) has the argument offset, set to 3, and has the effect of taking the value in the row three rows above the current row. It adds the Sum(Sales) value for the current Customer to the value for the Customerthree rows above. The values returned for the first three Customer rows are null.
The table also shows more complex measures: one created from Sum(Sales)+Above(Sum(Sales)) and one labeled Higher?, which is created from IF(Sum(Sales)>Above(Sum(Sales)), 'Higher').
Example 2:
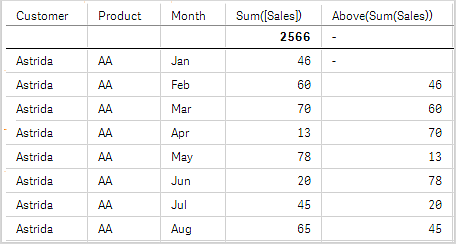
In the screenshots of tables shown in this example, more dimensions have been added to the visualizations: Month and Product. For charts with more than one dimension, the results of expressions containing the Above, Below, Top, and Bottom functions depend on the order in which the column dimensions are sorted by Qlik Sense. Qlik Sense evaluates the functions based on the column segments that result from the dimension that is sorted last. The column sort order is controlled in the properties panel under Sorting and is not necessarily the order in which the columns appear in a table.
In the following screenshot of table visualization for Example 2, the last-sorted dimension is Month, so the Above function evaluates based on months. There is a series of results for each Product value for each month (Jan to Aug) - a column segment. This is followed by a series for the next column segment: for each Month for the next Product. There will be a column segment for each Customer value for each Product.
Example 3:
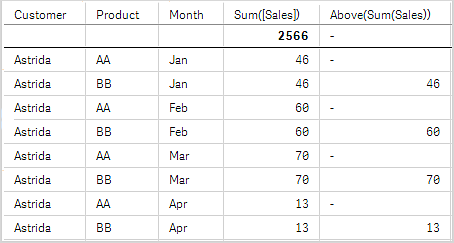
In the screenshot of table visualization for Example 3, the last sorted dimension is Product. This is done by moving the dimension Product to position 3 in the Sorting tab in the properties panel. The Above function is evaluated for each Product, and because there are only two products, AA and BB, there is only one non-null result in each series. Row BB for Jan shows the value for Sum(Sales), for row AA, the value is null. The value in each row AA will always be null, as there is no AA is the first value of Product in the column segment. The second series is evaluated on AA and BB for Feb, and so on for the first Customer value, Astrida. When all the months are exhausted for the first Customer value, the sequence is repeated for the second Customer value, and so on.
|
Example 4: |
Result |
|---|---|
|
The Above function can be used as input to the range functions. For example: RangeAvg (Above(Sum(Sales),1,3)). |
Returns the average of the three results of the Sum(Sales) function evaluated on the three rows immediately above the current row. |
Data used in examples:
Monthnames:
LOAD * INLINE [
Month, Monthnumber
Jan, 1
Feb, 2
Mar, 3
Apr, 4
May, 5
Jun, 6
Jul, 7
Aug, 8
Sep, 9
Oct, 10
Nov, 11
Dec, 12
];
Sales2013:
crosstable (Month, Sales) LOAD * inline [
Customer|Jan|Feb|Mar|Apr|May|Jun|Jul|Aug|Sep|Oct|Nov|Dec
Astrida|46|60|70|13|78|20|45|65|78|12|78|22
Betacab|65|56|22|79|12|56|45|24|32|78|55|15
Canutility|77|68|34|91|24|68|57|36|44|90|67|27
Divadip|57|36|44|90|67|27|57|68|47|90|80|94
] (delimiter is '|');
To get the months to sort in the correct order, when you create your visualizations, go to the Sorting section of the properties panel, select Month and mark the checkbox Sort by expression. In the expression box write Monthnumber.