
General information for a Full Load
General information about the Full Load is presented in a graphical format. The following figure shows the graphical information displayed when a task is running.
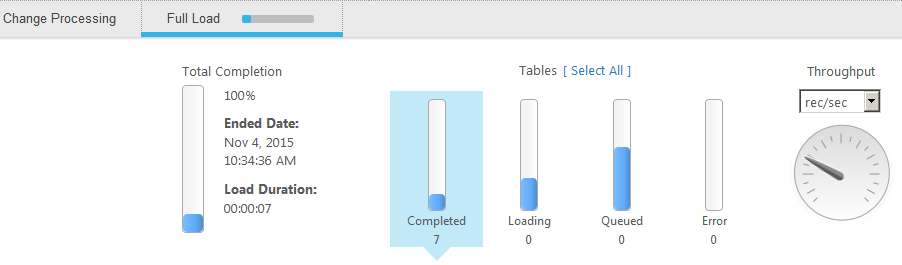
This section has the following information:
-
Status bars: Indicates the status of the tables being loaded.
- Completed: The number of tables that finished loading into the target endpoint.
- Loading: The number of tables that are in the process of loading into the target endpoint.
- Queued: The number of tables that are waiting to load into the target endpoint.
- Error: The number of tables that could not be loaded due to an error. See Accessing task messages and notifications for information about error messages.
- Full-load total completion bar: Displays the progress of all records being loaded to the target endpoint. The bar is located in the Full Load tab at the top of the graph section.
- Throughput gauge: Displays the current throughput.Throughput displays the number of events read in the task for a specified amount of time.
You can also view Detailed information for the Full Load.