Example: Moving QlikView content to Qlik Sense using the QlikView converter
This topic provides an example of converting a document in QlikView to an app in Client-Managed Qlik Sense.
We do the following in the example:
- Convert objects in a QlikView document called Sales.qvw using the QlikView converter.
- Place the objects in a Qlik Sense app.
- Make our data source available in Qlik Sense.
- Modify the load script in Qlik Sense to connect to the data source.
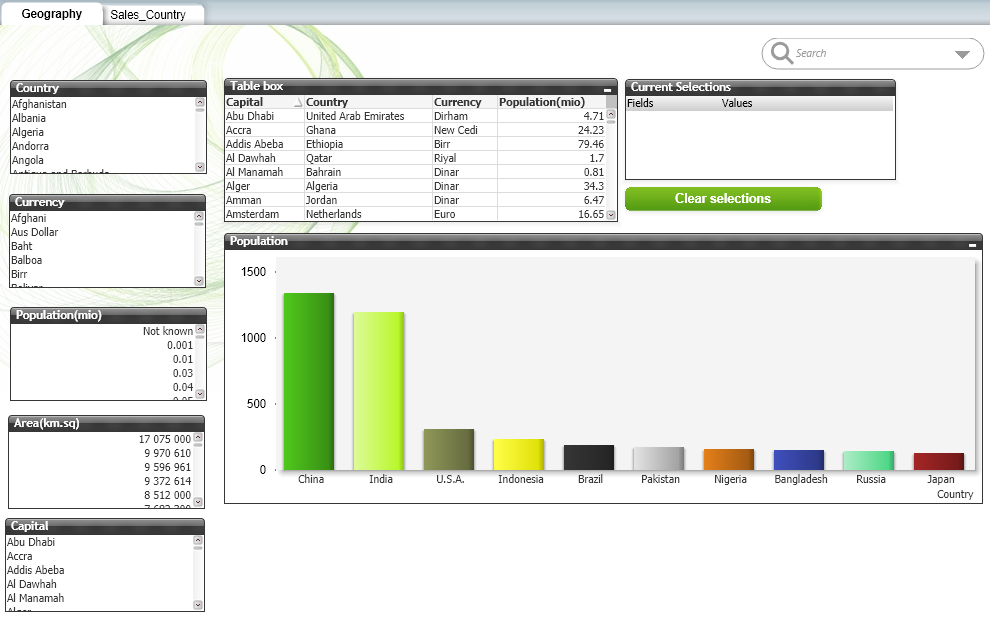
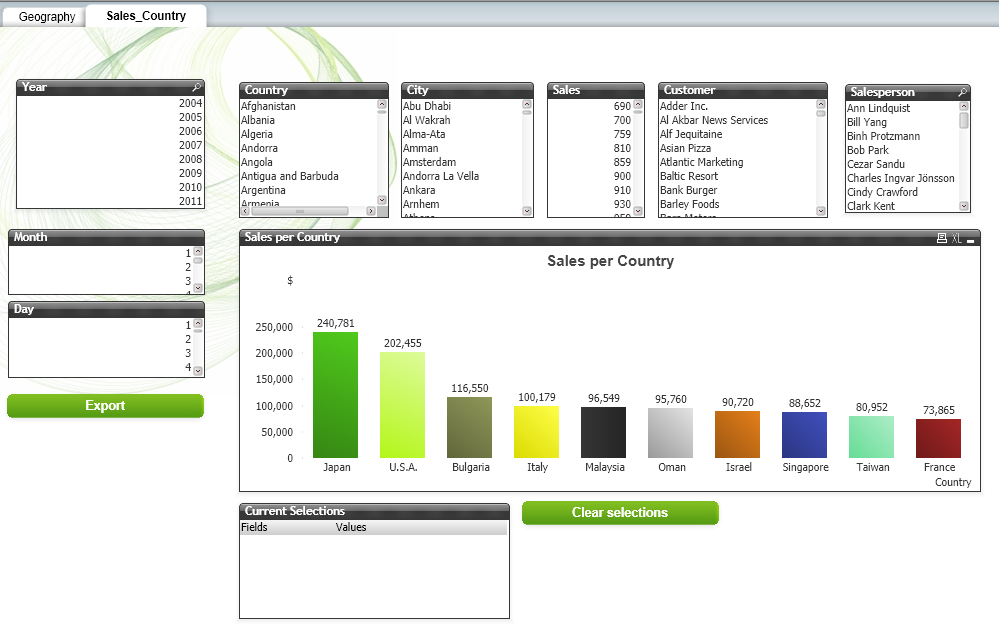
The document contains two sheets called Geography and Sales_Country.
Geography sheet in QlikView

Sales_Country sheet in QlikView

The document contains the following objects that will be converted:
- Charts
- List boxes. These are loaded as filter panes in Qlik Sense.
- Table box
- Data model
- Load script. Directory path will be changed in Qlik Sense. Also, data files will uploaded Qlik Sense so that they can be loaded with the script.
The Search box, and the Clear selections and Export buttons, will not be converted. This functionality is built into Qlik Sense.
For more examples of recreating QlikView behavior in Qlik Sense, see Example: Manually recreating QlikView content in Qlik Sense.
Requirements
- Access to the Dev Hub in Client-Managed Qlik Sense.
- Permission to upload data files to the Qlik Sense server. This is required for the data load part of the example only.
Restrictions
You cannot use the QlikView converter to convert documents that are larger than 500 MB on disk. You can reduce the amount of data in a document, or save the document without data, to reduce the size of a document without losing assets.There are app size and data reload limits in Qlik Sense. The limits depend on your edition of Qlik Sense. For more information, see the Qlik Pricing page. If the requirements for your app exceeds these limits, you can instead publish your QlikView documents, and links to documents, in the Create page of the Analytics activity center.
Convert a basic QlikView document to a Qlik Sense app
We do the following in this example:
-
Open the Dev Hub in Qlik Sense, and then select QlikView converter.
For more information, see QlikView converter.
- Drag and drop the Sales.qvw document into the converter. Qlik Sense processes the document.
-
Select the Sales document, and then select all objects for the Geography sheet (SH02) in the Visualizations tab. Also, select all objects for Sales_Country (SH04) sheet, with the exception of the Country filter pane. This table is repeated in the converter because it appears on both sheets.
The objects will be created as master items in Qlik Sense.You can delete master items that are not required in Qlik Sense later.
Visualizations tab in Sales document in converter tool

-
Review the other tabs for objects that will be converted. If there are any dimensions or measures with duplicate names, you can rename them now to avoid confusion in Qlik Sense.
Dimensions tab in Sales document in converter tool

-
Click Create app. The Sales app is created in the Qlik Sense hub.
Sales app in Qlik Sense.

- Open the Sales app and create a new sheet. Name the sheet Geography.
-
Open the sheet, click Edit sheet, and then click Master items. The converted dimensions, measures, and visualizations are listed in their respective tabs.
Converted dimensions, measures, and visualizations

-
Click an object to view more information. The tag converter-auto-created indicates that the object was created by the converter.
Information about Population visualization

-
Drag the following master visualizations onto the sheet:
- Country
- Currency
- Population(mio)
- Area(km.sq)
- Table box
- Population
Geography sheet with converted objects

- Adjust the sorting on the Population chart.
Click the Population chart, and choose to edit the master item.

The Edit master visualization window opens.
In the Properties panel, click Sorting, and then move Population above Country. This re-sorts the data so that the chart matches that from the original QlikView document.
Edit master visualization

Click Done. The Edit master visualization window closes and the visualization is updated on the sheet. The Geography sheet is complete.
Completed Geography sheet

If you make a selection on the sheet, you can clear it in the Selections toolbar. This replaces the Clear selections box in QlikView.
Selection in Geography sheet

-
Recreate the Sales_Country sheet by dragging the visualizations from the Master items onto the sheet.
Sales_Country sheet

-
You can open the global search at any time by pressing Control + F on your keyboard. This replaces the Search box in QlikView
Global search

-
To download data, you can right-click an object, click Download as..., and then click Data.
Download data

- Upload the data files to a folder called Data Sources on the Qlik Sense server. This allows us to connect to the files with the data load script.
- We then create a connection from the Sales app.
- Open the Data load editor from the Prepare tab in the top toolbar.
- Click Create new connection, and then select Folder in the window that opens.
Navigate to the Data Sources folder, and then select it. Name the connection and then click Create.
Create new connection

The connection is created and added to Data connections.
Data connections

-
Next we change directory path in our load script in the Data load editor so that it refers to our data connection. The path needs to be changed because the script that was imported from QlikView contains the path to a local directory in QlikView.
Data load script referring to local directory
In the above example, we change:
FROM [Data Sources\Country1.csv]to:
FROM [lib://Data Sources (<user_id>)/Country1.csv]where your <user_id> is required to make the connection.
We then make the change for all Load statements in the script.
-
We can now load the data by clicking Load data. A progress window indicates that our data has been loaded.
Data load progress