Server persistence and post-processing
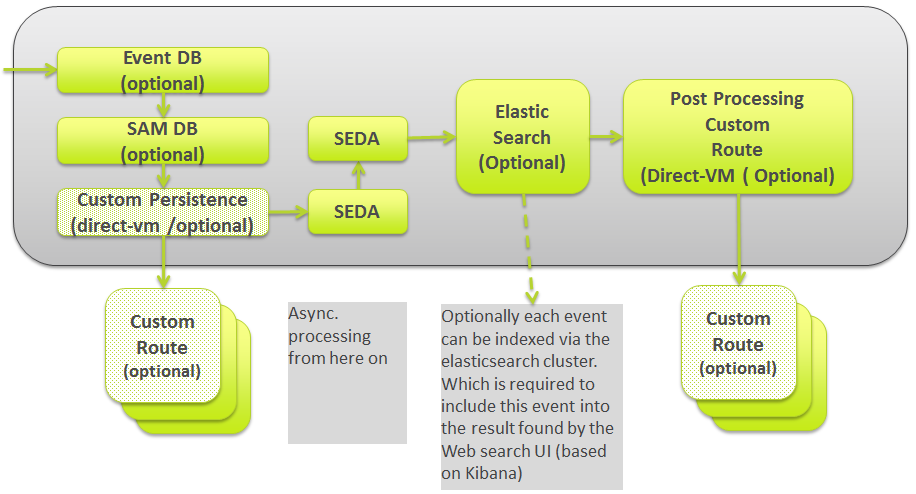
After the pre-processing part, the event goes into the persistence, search and post-processing steps, which are shown in the following diagram:

An event can be handled by one or more persistence backends:
-
Event Logging Database,
-
Service Activity Monitoring Database (only applicable for events created by the Service Activity Monitoring Agent),
-
the custom persistent step.
None of these steps is mandatory (even the Event Logging Database one) and each step can be activated or deactivated by category.
Example:
persistence.event.db.active.default=false
persistence.event.db.active.audit=true
persistence.event.db.active.sam=false

persistence.sam.db.active.default=false
persistence.sam.db.active.sam=true

persistence.custom.active.default=false
persistence.custom.active.system=false
persistence.custom.routeid.system=myCustomServerPersistenceRoute
In the above example configuration:
-
Events with the audit=true parameter will be stored in the Event Database.
-
Events with the sam category will be stored in the Service Activity Monitoring Database.
-
Events with the system category will be handled by the custom route named myCustomServerPersistenceRoute and called via Direct-VM, even though what the custom route does with the event is up to the custom route.
The Event Database has the database structure as defined in the sub-Event Database Structure of the Event Logging - API's and Data Structures, and is accessible via JDBC using a predefined datasource:
event.logging.db.datasource=el-ds-mysql
event.logging.db.dialect=mysqlDialect
The Service Activity Monitoring Database is exactly the same database as the one used by the Service Activity Monitoring Server. The Service Activity Monitoring Database step will remap the Event Structure to the Service Activity Monitoring Event structure and will try to map custom information fields to the fixed columns of the Service Activity Monitoring Event structure (flowid, servicename, and so on), as this data is provided by the Service Activity Monitoring Agent and just - in between - converted to the Event Logging Structure. All information is available and the Service Activity Monitoring Database will be filled consistently in the same way as the Service Activity Monitoring Server is. This way, records written by the Event Logging Service Activity Monitoring Database step can also be retrieved and viewed via the Service Activity Monitoring Retrieval Service (part of the Service Activity Monitoring feature) and via the Service Activity Monitoring User Interface in the Talend Administration Center.
The Service Activity Monitoring Database has the same database structure as the one defined by the Service Activity Monitoring feature, for more information, see the Service Activity Monitoring chapter in the Talend ESB Infrastructure Services Configuration Guide, and is accessible via JDBC using a predefined datasource:
sam.db.datasource=ds-mysql
sam.db.dialect=mysqlDialect
The Event Database persistence uses the same data source as the one used by the Service Activity Monitoring Server. This way, the configuration and setup of the Database driver is exactly the same as the one described in the Service Activity Monitoring chapter of the Talend ESB Infrastructure Services Configuration Guide.
It is important to note that an event can be handled by each of the persistent steps. This means a single event can be saved in the Event Database, Service Activity Monitoring Database and handled by the custom route. Even though this implementation will certainly reduce the performance of the overall handling of a single event, it is technically possible with the feature.
After this, the synchronous processing is done and an asynchronous seda communication will now be used.
The last step is to send events to:
-
the search indexing (Talend LogServer based on Elasticsearch).
-
a final custom post-processing, for example, to reformat the event and to send it to an intrusion detection system (IDS) stored on Hadoop HDFS, to process this event further with Big Data technologies, or to send it to a Complex Event Processing engine (CEP) or to a larger scale log analysing system like Splunk, or to any other destination it can be sent to.
The search indexing step is optional and can be configured per category in the org.talend.eventlogging.server.cfg file.
Example:
search.active.default=false
search.active.sam=true
In the above example, only the sam Event category events will be indexed by the Talend LogServer, and no other event.
Example:
search.active.default=true
search.active.sam=false
In the example above, all events will be indexed, except events with the sam category. Unless, they have the audit flag set to true. In that case, the default is used, so they will be indexed. To avoid this, search.active.audit=false must be configured to also exclude audit events from being indexed.
The Search Indexing step would convert the Event Exchange structure to a JSON format. The same conversion as the one performed by the Talend Event Logging Agent to send it to the Event Logging Collector Server.
The Event Logging Search Service is based on Elasticsearch and can be configured as follows in the org.talend.eventlogging.server.cfg file:
elasticsearch.available=true
elasticsearch.host=localhost
elasticsearch.port=9200
elasticsearch.inddexname=talendesb
elasticsearch.indextype=ESB
With the elasticsearch.available parameter, the entire feature can be activated or deactivated. If it is deactivated, the category-based configuration shown above will not be used at all.
The elasticsearch.host specifies how the Talend LogServer or Cluster can be reached, locally on the same machine or remotely. The other parameters are specific to the Talend LogServer.
The last step in the Collector Service is the Custom Post-processing step, which allows the user to send the message to any kind of destination.
For example, the user might want to reformat the event and send it to an intrusion detection system (IDS), store it on Hadoop HDFS to process this event further with Big Data technologies, send it to a Complex Event Processing Engine (CEP) or to a larger scale log analysing system like Splunk, or any other destination.
Example:
postprocessing.custom.routeid.default=myCustomServerPostRoute
postprocessing.custom.routeid.audit=myCustomServerAuditPostRoute
postprocessing.custom.routeid.security=myCustomServerSecurityPostRoute
As in many other configurations, the related route will be called via Direct-VM and must be deployed on the same Talend Runtime or JVM as the Talend Event Logging Collector Server.
