Skip to main content Skip to complementary content

Profiling address columns

Using the Profiling perspective of Talend Studio, you will analyze a few customer columns including email and postal.

Using out-of-box indicators and patterns on these columns, you can show in the analysis results the matching, and non-matching address data, the number of most frequent records for each distinct pattern and the row, duplicate, and blank counts in each column.

Defining the column analysis

Procedure

  1. In the DQ Repository tree view, expand the Data Profiling folder.
  2. Right-click the Analyses folder and select New Analysis.
    Analyses menu

    The Create New Analysis wizard opens.

    Create new analysis wizard
  3. In the filter field, start typing basic column analysis, select Basic Column Analysis and click Next.
  4. In the Name field, enter a name for the current column analysis.
    Information noteImportant:

    Do not use the following special characters in the item names: ~ ! ` # ^ * & \\ / ? : ; \ , . ( ) ¥ ' " « » < >

    These characters are all replaced with "_" in the file system and you may end up creating duplicate items.

  5. Set column analysis metadata (Purpose, Description and Author) in the corresponding fields and click Next.
  6. Click Finish.

Selecting the address columns and setting sample data

Procedure

  1. Expand DB connections and browse to the address columns you want to analyze.
    DB connections expanded to select the columns to be analyzed.
  2. Select the columns and click Finish to close the wizard.

    A file for the newly created column analysis is listed under the Analysis node in the DQ Repository tree view, and the analysis editor opens with the analysis metadata.

  3. In the Data preview section, click Refresh Data.
    Overview of the Data preview section.

    The data in the selected columns is displayed in the table.

    You can change your data source and your selected columns by using the New Connection and Select Data buttons respectively.

  4. In the Limit field, set to 50 the number for the data records you want to display in the table and use as sample data.
  5. Select n random rows to list 50 random records from the selected columns.

Setting system indicators

Procedure

  1. From the Data Preview section in the analysis editor, click Select indicators to open the Indicator Selection dialog box.
    Overview of the Indicator Selection dialog box.
  2. Click in the cells next to indicators names to set indicator parameters for the analyzed columns and click OK.

    You want to see the row, blank, and duplicate counts in all columns to see how consistent the data is. Also you want to use the Pattern Frequency Table indicator on the email and postal columns in order to compute the number of most frequent records for each distinct pattern or value.

    Indicators are added accordingly to the columns in the Analyzed Columns section.

    Overview of the Analyzed Columns section.
  3. Click Options icon next to the Blank Count indicator and set 0 in the Upper threshold field.

    Defining thresholds on indicators is very helpful as it will write in red the count of the null values in the analysis results.

    Defining thresholds in the Indicator settings wizard.

Setting patterns

You would want to match the content of the email column against a standard email format and the postal column against a standard US ZIP code format.

This will define the content, structure, and quality of emails and ZIP codes and give a percentage of the data that match the standard formats and the data that does not match.

Procedure

  1. In the Analyzed Columns view, click Add pattern icon next to email to open the Pattern Selector dialog box.
  2. Expand Regex > internet, select the Email Address check box and click OK to close the dialog box.
  3. Click Options icon next to the Email Address indicator and set 98.0 in the Lower threshold (%) field.

    If the number of the records that match the patterns is fewer than 98%, it will be written in red in the analysis results.

  4. Do the same to add to the postal column the US Zipcode Validation pattern from the address folder.

    For more information on pattern types and their usage when analyzing data, see Patterns in the Talend Studio User Guide.

Executing the analysis and displaying the profiling results

Procedure

  1. Save the column analysis in the analysis editor and then press F6 to execute it.
    A group of graphics is displayed in the Graphics panel to the right of the analysis editor showing the results of the column analysis including those for pattern matching.
  2. Click the Analysis Results tab at the bottom of the analysis editor to access a more detail result view.
    These results show the generated graphics for the analyzed columns accompanied with tables that detail the statistic and pattern matching results.

Results

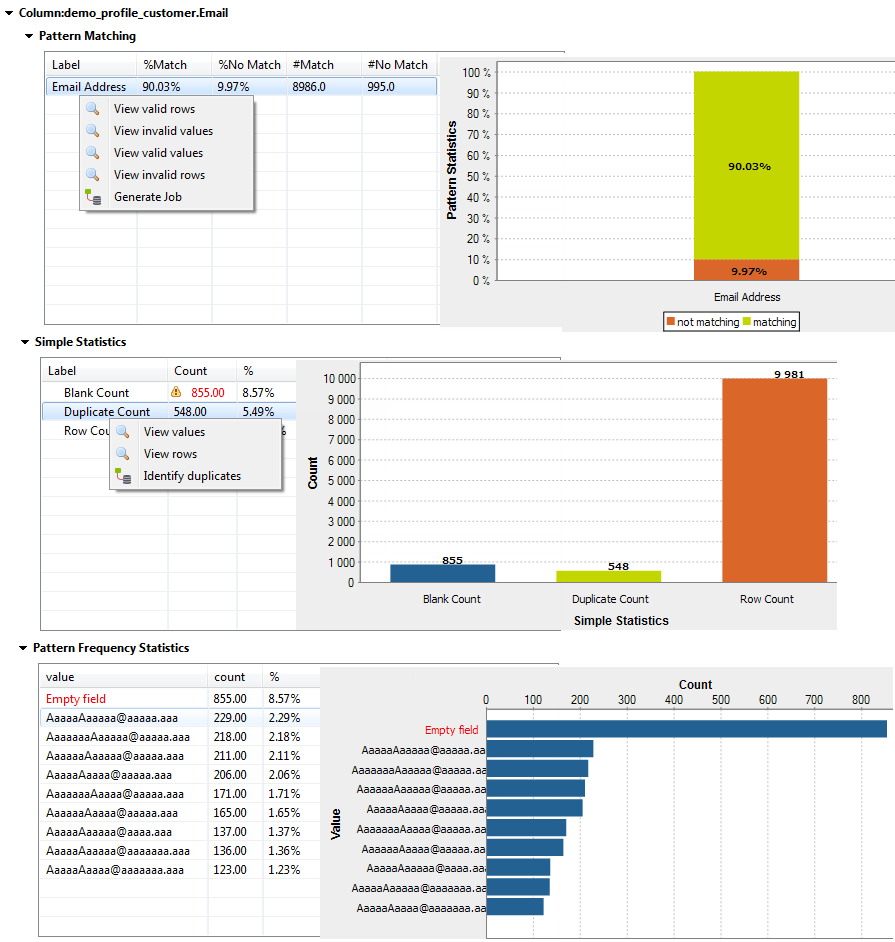
Overview of the Pattern statistics for a specific column.

The pattern matching results show that about 10% of the email records do not match the standard email pattern. The simple statistic results show that about 8% of the email records are blank and that about 5% are duplicates. And the pattern frequency results give the number of most frequent records for each distinct pattern. This shows that the data is not consistent and you need to correct and cleans the email data before starting your campaign.

The results for the postal column look as the following:
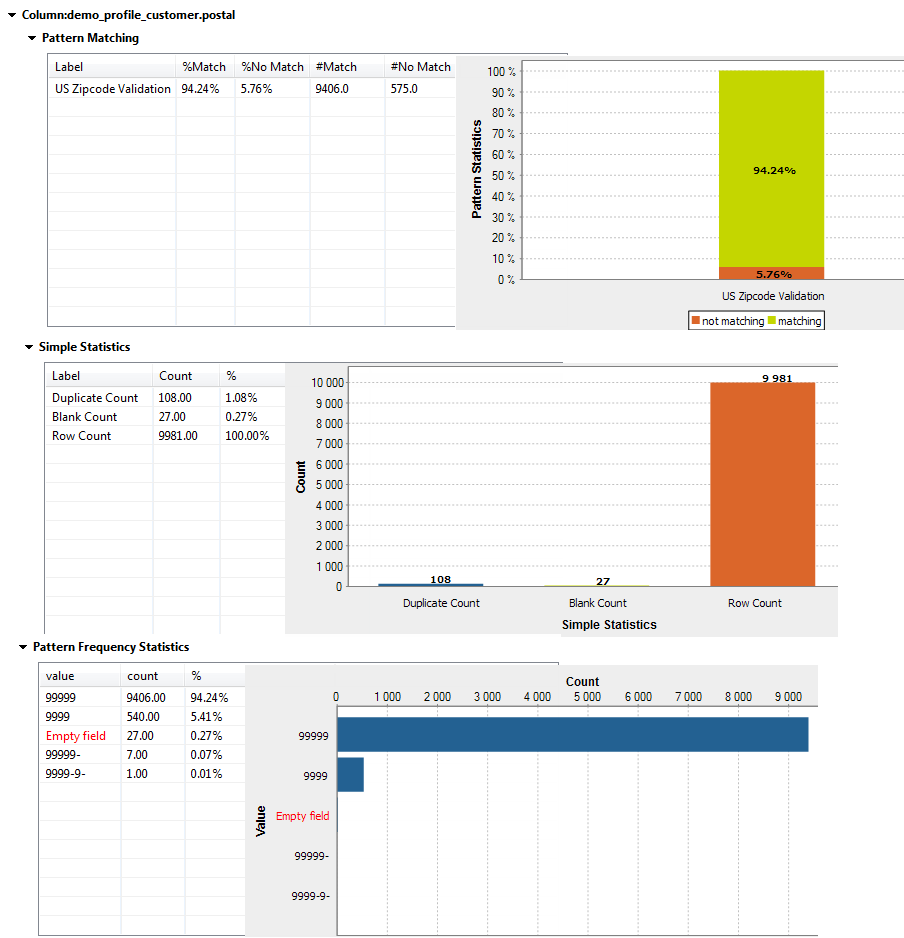
Overview of the Pattern statistics for a specific column.

The result sets for the postal column give the count of the records that match and those that do not match a standard US ZIP code format. The results sets also give the blank and duplicate counts and the number of most frequent records for each distinct pattern. These results show that the data is not very consistent.

Then some percentage of the customers can not be contacted by either email or US mail service. These results show clearly that your data is not very consistent and that it needs to be corrected.

Did this page help you?

If you find any issues with this page or its content – a typo, a missing step, or a technical error – please let us know!