How to view analyzed data
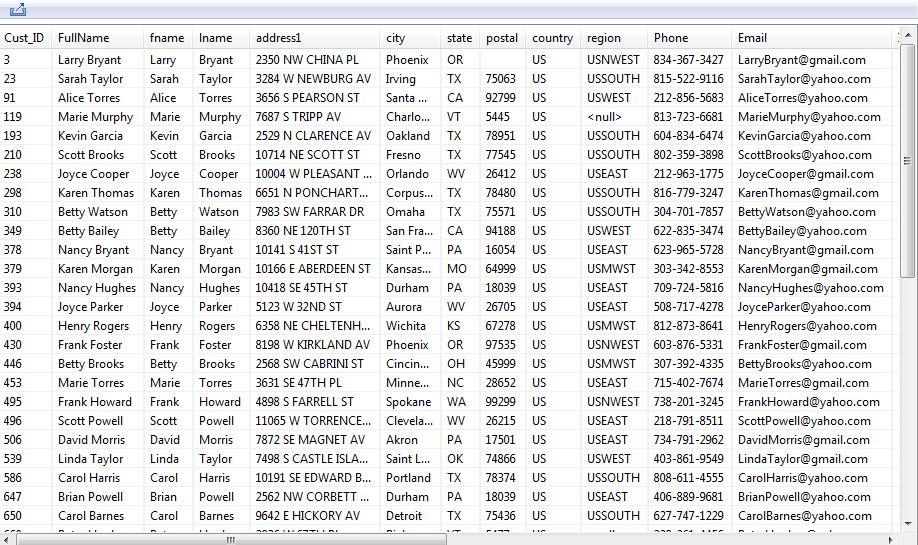
After running the column analysis using the SQL engine and from the Analysis Results view of the analysis editor, you can right-click any of the rows/bars in the result tables/charts and access a view of the actual analyzed data.
This could be very helpful to see invalid rows for example and start analyzing what needs to be done to clean such data.
Procedure
- At the bottom of the analysis editor, click the Analysis Results tab to open a detailed view of the analysis results.
- Right-click the data row in the statistic results of the email column and select View rows for example.
Results
The Data Explorer perspective opens listing the invalid rows in the email column.

