
Generating a report file from Talend Studio
Procedure
-
In the DQ Repository tree view, right-click the analysis
name and select New Report.
The report editor is displayed with the selected analysis listed in the Analysis List.

-
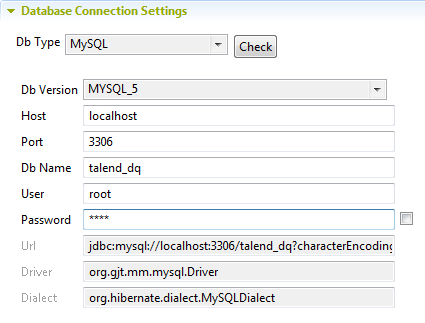
In the Database Connection Settings view, set the
connection parameters to the data mart where you want to store the report
results.
-
Save the report and click
 on the editor toolbar to generate the report
file.
on the editor toolbar to generate the report
file.
Results
A report file is generate and listed under the Reports node in the DQ Repository tree view. The report shows the evolution through time of the simple statistics indicators and the patterns used on the email and postal columns.
Below are the results of the email column:
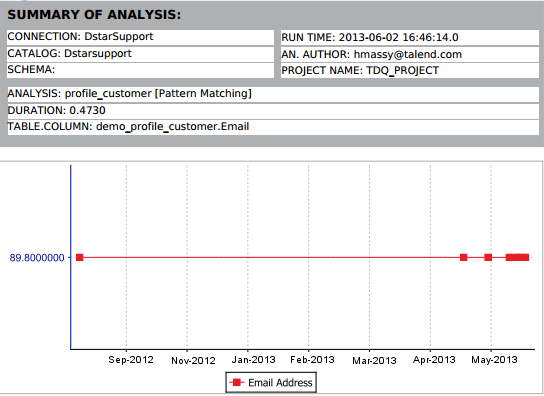
This chart shows that 89.80% of the email addresses are valid right now.
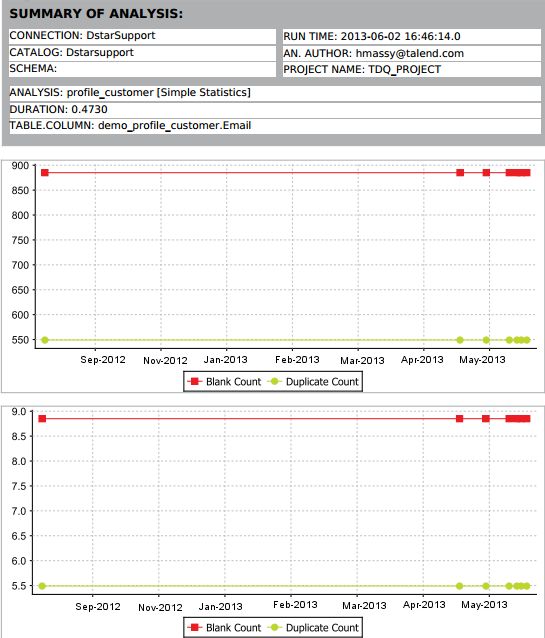
For the simple statistics indicators, there are two charts: the first indicates the change in the statistics and the second indicates the percentage of that change.
Generating this report repeatedly will give a flat line if there is no change in data. The line will start to go upwards if data is fixed and downwards if data gets less accurate and consistent.
For more information on reports, see Reports in the Talend Studio User Guide.
After generating this report in Talend Studio, business users can access it from Talend DQ Portal.