# Sheet view
App developers add visualizations and other elements to sheets in an app. App consumers interact with the sheet for data analysis. App developers and app consumers can interact with Insight Advisor to generate visualizations using natural language queries.
Click Sheets in the assets panel to select and open a sheet.
Develop sheets in edit mode. Interact with sheets in analysis mode. Explore your data with Insight Advisor in Insight Advisor.
## Toolbar
The toolbar contains options to create and navigate in your sheet and app. Within the toolbar, the selections bar contains options to make selections in your data and to clear those selections, and to search for data. The selections tool also displays all selections that have been made. The following buttons are available in the toolbar:
* Assets: Open or close the assets panel.
* Sheets: Open the assets panel to Sheets.
* Bookmarks: Open the assets panel to Bookmarks.
* Insight Advisor: Open or close Insight Advisor.
* Smart search (the Smart search icon): Search the entire dataset in your app.
* Selection buttons:
* Step back(the Step back icon): Step back in the current selection.
* Step forward(the Step forward icon): Step forward in the current selection.
* Clear all selections (the Clear all selections icon): Clear all selections.
* Selections tool (the Selections tool icon): Open or close the selections tool
* Edit sheet: Open or close the edit mode. If the sheet cannot be edited, click Duplicate to edit a duplicate of the sheet.
## Edit
Click Edit sheet to edit a sheet.
Sheet view in edit mode
Sheet view in edit mode
Sheet view in edit mode 
You can do the following:
* Click Sheets to add a new sheet, or to navigate to a sheet.
* Click Assets to open the assets panel. Add assets to your sheet. For example, you can add a visualization to a sheet.
For assisted creation of visualizations, click Use assisted explore to use Insight Advisor. See: [Creating visualizations with Insight Advisor](https://help.qlik.com/en-US/sense/May2025/Subsystems/Hub/Content/Sense_Hub/Insights/insight-advisor-create-visualizations.htm)
* Click Properties to open the properties panel. Configure the properties for a sheet or visualization. For example, you can add dimensions and measures to a visualization. See: [Properties panel](https://help.qlik.com/en-US/sense/May2025/Subsystems/Hub/Content/Sense_Hub/Properties/properties-panel.htm)
### Assets panel in edit mode
In edit mode, the assets panel contains:
* Sheets: View and edit sheets in the app.
[Structuring an app using sheets](https://help.qlik.com/en-US/sense/May2025/Subsystems/Hub/Content/Sense_Hub/Sheets/create-sheets-for-structure.htm)
* Bookmarks: View and edit bookmarks in the app.
[Bookmarking selections](https://help.qlik.com/en-US/sense/May2025/Subsystems/Hub/Content/Sense_Hub/Bookmarks/keep-track-of-important-data.htm)
* Fields: Add data to visualizations from available fields.
[Data assets in visualizations](https://help.qlik.com/en-US/sense/May2025/Subsystems/Hub/Content/Sense_Hub/Visualizations/data-in-your-visualization.htm)
* Master items: Add data to visualizations from available master items.
[Reusing assets with master items](https://help.qlik.com/en-US/sense/May2025/Subsystems/Hub/Content/Sense_Hub/Assets/work-with-master-items.htm)
* Charts: Add visualizations to the sheet.
[Creating and editing visualizations](https://help.qlik.com/en-US/sense/May2025/Subsystems/Hub/Content/Sense_Hub/Visualizations/create-visualizations-overview.htm)
* Custom objects: Add custom objects to the sheet.
[Creating a visualization using a custom object](https://help.qlik.com/en-US/sense/May2025/Subsystems/Hub/Content/Sense_Hub/Visualizations/create-visualization-extensions.htm)
* App navigation links: Add links to build on-demand apps.
[Building an on-demand app](https://help.qlik.com/en-US/sense/May2025/Subsystems/Hub/Content/Sense_Hub/LoadData/creating-OnDemand-app.htm)
* Dynamic views: Connect a base app to a template app to use master visualizations from that app as dynamic charts in your sheets.
[Managing data with dynamic views](https://help.qlik.com/en-US/sense/May2025/Subsystems/Hub/Content/Sense_Hub/DynamicViews/dynamic-views.htm)
All assets may not be available, depending on your Qlik Sense configuration.
Assets panel in edit mode
Assets panel in edit mode
Assets panel in edit mode 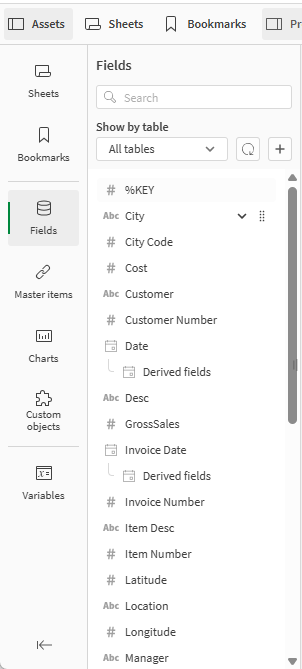
### Sheets
Sheets contains all sheets available to you in an app. Click Create new sheet to add another sheet to the app.
### Bookmarks
Bookmarks contains all bookmarks available to you in an app. Click Create new bookmark to add another bookmark the app.
See: [Bookmarking selections](https://help.qlik.com/en-US/sense/May2025/Subsystems/Hub/Content/Sense_Hub/Bookmarks/keep-track-of-important-data.htm)
### Fields
Fields represent the data that is available in your app. Drag a field onto a sheet to create visualizations with chart suggestions. Drag a field onto a visualization to add the field to a visualization.
Additionally, right-click on fields to do the following:
* Create a new master dimension. See: [Creating a master dimension from a field](https://help.qlik.com/en-US/sense/May2025/Subsystems/Hub/Content/Sense_Hub/Dimensions/create-master-dimension-from-field.htm)
* Create a new master measure. See: [Creating a master measure from a field](https://help.qlik.com/en-US/sense/May2025/Subsystems/Hub/Content/Sense_Hub/Measures/create-master-measure-field.htm)
* Create a calendar measure. See: [Create calendar measures](https://help.qlik.com/en-US/sense/May2025/Subsystems/Hub/Content/Sense_Hub/Measures/create-calendar-measure.htm)
* View field settings. See: [Always one selected value](https://help.qlik.com/en-US/sense/May2025/Subsystems/Hub/Content/Sense_Hub/DataSource/select-single-value.htm)
Depending on your permissions in the space that the app is in, you can reload app data and add new data from Assets. Reload app data from Assets by clicking the Reload icon. Add additional data sources to the app by clicking the Add icon and selecting Data catalog or Files and other sources.
#### Date and time
All date fields are marked with the Date and time icon and can be expanded to use date and time attributes of the field. Date and time attributes are created automatically when you use the Data manager. If you used the data load script to load data, you need to create the date and time attributes using derived fields.
See: [Date & time fields](https://help.qlik.com/en-US/sense/May2025/Subsystems/Hub/Content/Sense_Hub/Assets/date-time-fields.htm)
#### Map data
All fields recognized as geopoints in map visualizations are marked with the Map icon.
See: [Loading your own map data](https://help.qlik.com/en-US/sense/May2025/Subsystems/Hub/Content/Sense_Hub/Visualizations/Map/load-map-data.htm)
### Master items
Create dimensions, measures, and visualizations as master items that can be re-used in your app.
See:
* [Reusing visualizations with a master visualization](https://help.qlik.com/en-US/sense/May2025/Subsystems/Hub/Content/Sense_Hub/Visualizations/create-master-visualization.htm)
* [Reusing dimensions with master dimensions](https://help.qlik.com/en-US/sense/May2025/Subsystems/Hub/Content/Sense_Hub/Dimensions/create-master-dimension.htm)
* [Reusing measures with master measures](https://help.qlik.com/en-US/sense/May2025/Subsystems/Hub/Content/Sense_Hub/Measures/create-master-measure.htm)
### Charts
Drag charts onto your sheet to create visualizations.
See: [Get started with visualizations](https://help.qlik.com/en-US/sense/May2025/Subsystems/Hub/Content/Sense_Hub/Visualizations/get-started-with-visualizations.htm)
### Custom objects
Enhance your apps with custom-designed visualizations.
See: [Creating a visualization using a custom object](https://help.qlik.com/en-US/sense/May2025/Subsystems/Hub/Content/Sense_Hub/Visualizations/create-visualization-extensions.htm)
### App navigation links
Build on-demand apps using app navigation links. On-demand apps load a subset of the data that is loaded in aggregate form by a selection app.
See: [Building an on-demand app](https://help.qlik.com/en-US/sense/May2025/Subsystems/Hub/Content/Sense_Hub/LoadData/creating-OnDemand-app.htm)
### Dynamic views
Create dynamic views to query and view relevant subsets of large data sets in charts that can be dynamically refreshed as selections are made.
See: [Managing data with dynamic views](https://help.qlik.com/en-US/sense/May2025/Subsystems/Hub/Content/Sense_Hub/DynamicViews/dynamic-views.htm)
### Variables
Click the Variables icon to open the variables dialog.
See: [Variables dialog](https://help.qlik.com/en-US/sense/May2025/Subsystems/Hub/Content/Sense_Hub/Sheets/variables-dialog.htm)
### Search
Find assets using the search field. As you start to type in the search field, all items that have a name or a tag that contains the search string, are presented.
See: [Searching in the assets panel](https://help.qlik.com/en-US/sense/May2025/Subsystems/Hub/Content/Sense_Hub/Assets/search-assets.htm)
## Properties panel
Configure properties for a sheet or visualization in the properties panel.
Click Properties in the toolbar of a sheet to open the properties panel. You have to be in edit mode.
Click on the sheet to view the properties for the sheet. Click on a visualization to view the properties for the visualization.
For sheets you can:
* Edit sheet title and description
* Add a thumbnail for a sheet
* Add a background color or image to a sheet
* Change the grid spacing, sheet size, and layout
* Apply alternate states to the sheet
* Add actions triggered when users navigate to the sheet
Depending on the visualization that you are editing, you have different options. Typically, you can do the following:
* Add dimensions and measures and specify how they are displayed
* Set the sorting order and sorting criteria
* Change the way the visualization appears
* Configure custom tooltips
See: [Creating and editing visualizations](https://help.qlik.com/en-US/sense/May2025/Subsystems/Hub/Content/Sense_Hub/Visualizations/create-visualizations-overview.htm)
## Analysis
Interact with visualizations and data in a sheet.
Sheet view in analysis mode
Sheet view in analysis mode
Sheet view in analysis mode 
You can do the following:
* Click Assets to create and manage assets for exploration of app content. This is a different assets panel than the one you see when you are editing a sheet. For more information about the assets panel in edit mode, see [Assets panel in edit mode](https://help.qlik.com/en-US/sense/May2025/Subsystems/Hub/Content/Sense_Hub/Sheets/sheet-view.htm#Assets).
* Make selections in a visualization to explore insights based on selections. See: [Exploring with selections](https://help.qlik.com/en-US/sense/May2025/Subsystems/Hub/Content/Sense_Hub/Selections/SelectionsToolbar/work-with-selections.htm)
* Create bookmarks based on selections. See: [Bookmarking selections](https://help.qlik.com/en-US/sense/May2025/Subsystems/Hub/Content/Sense_Hub/Bookmarks/keep-track-of-important-data.htm)
* Search your data. See: [Using smart search](https://help.qlik.com/en-US/sense/May2025/Subsystems/Hub/Content/Sense_Hub/Search/use-smart-search-tool.htm)
* Click Insight Advisor to generate recommendations for visualizations using natural language and simple configuration options. See: [Insight Advisor](https://help.qlik.com/en-US/sense/May2025/Subsystems/Hub/Content/Sense_Hub/Sheets/sheet-view.htm#_bm)
Selection actions
| User interface item | Action |
| --- | --- |
| the Selections - History icon | Step back in selections. |
| the Selections - step forward icon | Step forward in selections. |
| the Selections - Clear all icon | Clear all selections. |
| the Selection search icon | Open smart search to search in the entire data set.
For more information, see: [Using smart search](https://help.qlik.com/en-US/sense/May2025/Subsystems/Hub/Content/Sense_Hub/Search/use-smart-search-tool.htm) |
| the Selections tool icon | Open the selections tool, which is an extension of the selections bar. |
### Assets panel in analysis mode
In analysis mode, click Assets to open a panel where you can create and manage the following:
* Sheets: View and navigate sheets in the app. Create and group sheets.
[Structuring an app using sheets](https://help.qlik.com/en-US/sense/May2025/Subsystems/Hub/Content/Sense_Hub/Sheets/create-sheets-for-structure.htm)
* Bookmarks: View and navigate bookmarks in the app. Create new bookmarks.
[Bookmarking selections](https://help.qlik.com/en-US/sense/May2025/Subsystems/Hub/Content/Sense_Hub/Bookmarks/keep-track-of-important-data.htm)[Bookmarking selections](https://help.qlik.com/en-US/sense/May2025/Subsystems/Hub/Content/Sense_Hub/Bookmarks/keep-track-of-important-data.htm)
The assets panel can be resized by clicking and dragging the border of the assets panel. To pin the assets panel open in analysis mode, click the Pin assets icon.
You can make Sheets or Bookmarks full screen by clicking the Full screen icon.
You can view Sheets as a grid or list. Sheets can also be grouped together. For more information, see [Grouping sheets](https://help.qlik.com/en-US/sense/May2025/Subsystems/Hub/Content/Sense_Hub/Sheets/grouping-sheets.htm).
Assets panel in analysis mode
Assets panel in analysis mode
Assets panel in analysis mode 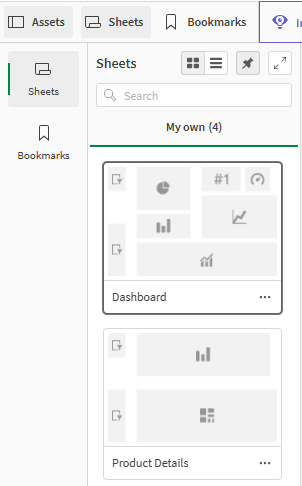
## Options menu
You can use the options menu to perform actions related to the visualization.
Options menu next to a chart
Options menu next to a chart
Options menu next to a chart 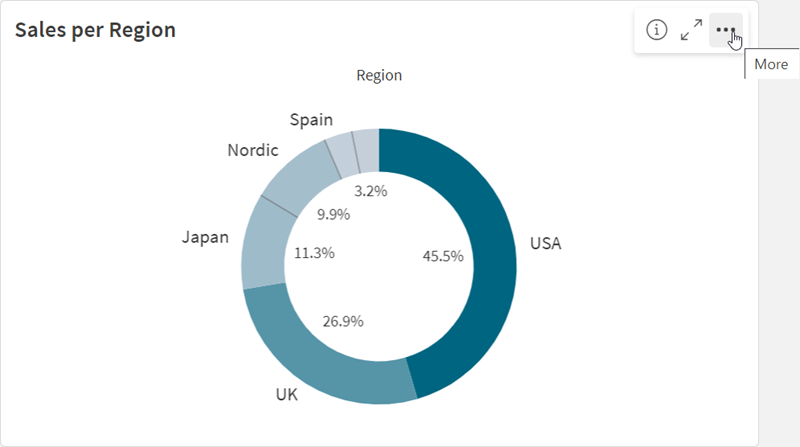
You can open the options menu by:
* Right-clicking on a chart.
* Clicking the hover menu the More icon.
Menu options will be different depending on:
* Whether you are editing or analyzing (viewing) charts in an app.
* The chart type.
* The privileges that have been assigned to you by your administrator.
* Custom settings for visualization menus that have been configured by the app developer (see [Hiding items in visualization menus](https://help.qlik.com/en-US/sense/May2025/Subsystems/Hub/Content/Sense_Hub/Apps/style-app.htm#HidingContext)).
Options menu for a chart with hover menu expanded
Options menu for a chart with hover menu expanded
Options menu for a chart with hover menu expanded 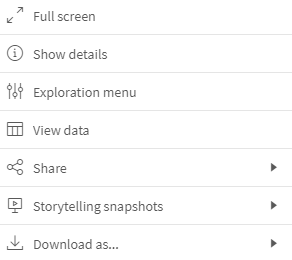
The menu looks different if you have touch screen mode enabled on a supported device. You can toggle touch support on and off by clicking or tapping the navigation button (the Navigation icon) and using the toggle for the Navigation icon.
### Options
Some of the available actions you might see in the options menu include:
Actions from the options menu
| Option | Sheet modes | Available actions |
| --- | --- | --- |
| the Full screen icon | Edit, analysis | Expand visualization to full-screen mode. |
| the Developer icon | Edit, analysis | Access the developer options for the visualization. To access this feature, add /options/developer to the URL. |
| the Show details icon | Analysis | Show details: See the fields and master items that make up the visualization. You can view their dependencies to see the fields that comprise them and their sources.
Details can be turned on and off for visualizations in the visualization properties panel under Appearance > General > Show details. |
| the Exploration menu icon | Analysis | Change certain visualization properties, without making selections or editing the sheet. See: [Visual exploration](https://help.qlik.com/en-US/sense/May2025/Subsystems/Hub/Content/Sense_Hub/UserInterface/visual-exploration-menu.htm) |
| the View data icon | Analysis | View the data for a visualization in a table.
View data offers an accessible option for viewing information in a charts that are not optimized for accessibility. For more information about accessibility, see:
|
| the Share icon | Analysis | Share the visualization in different ways, for example as an image, a link, or an embedded object. |
| the Storytelling snapshots icon | Analysis | Manage the storytelling snapshots available for the chart. For example, you can Take snapshot or access the Snapshot library. See: [Collecting insights for stories using snapshots](https://help.qlik.com/en-US/sense/May2025/Subsystems/Hub/Content/Sense_Hub/StoryTelling/Story/collect-insights-for-story.htm) |
| the Download as... icon | Analysis | Download the visualization in different formats, such as an image, PDF, or data file. |
| the Add to master items icon , Unlink visualization | Edit | Add the visualization as a master visualization so it can be reused by you and other app developers. You can also unlink the chart from an existing master visualization. See: [Reusing visualizations with a master visualization](https://help.qlik.com/en-US/sense/May2025/Subsystems/Hub/Content/Sense_Hub/Visualizations/create-master-visualization.htm) |
| the Cut icon , the Copy icon , the Paste icon , the Paste and replace icon | Edit | Standard actions allowing copying and pasting of visualizations across sheets. |
| the Delete icon | Edit | Delete the visualization from the sheet. |
| the Copy style icon , the Paste style icon | Edit | Copy the custom styling for a visualization and paste it onto another visualization. See: [Copying and pasting visualization styling](https://help.qlik.com/en-US/sense/May2025/Subsystems/Hub/Content/Sense_Hub/Visualizations/style-visualization.htm#Copying) |
## Insight Advisor
Click Insight Advisor to access Insight Advisor Search and Insight Advisor Analysis Types. You can ask a question in the Insights search field to generate visualizations with Insight Advisor Search.
Insight Advisor
Insight Advisor
Insight AdvisorInsight Advisor 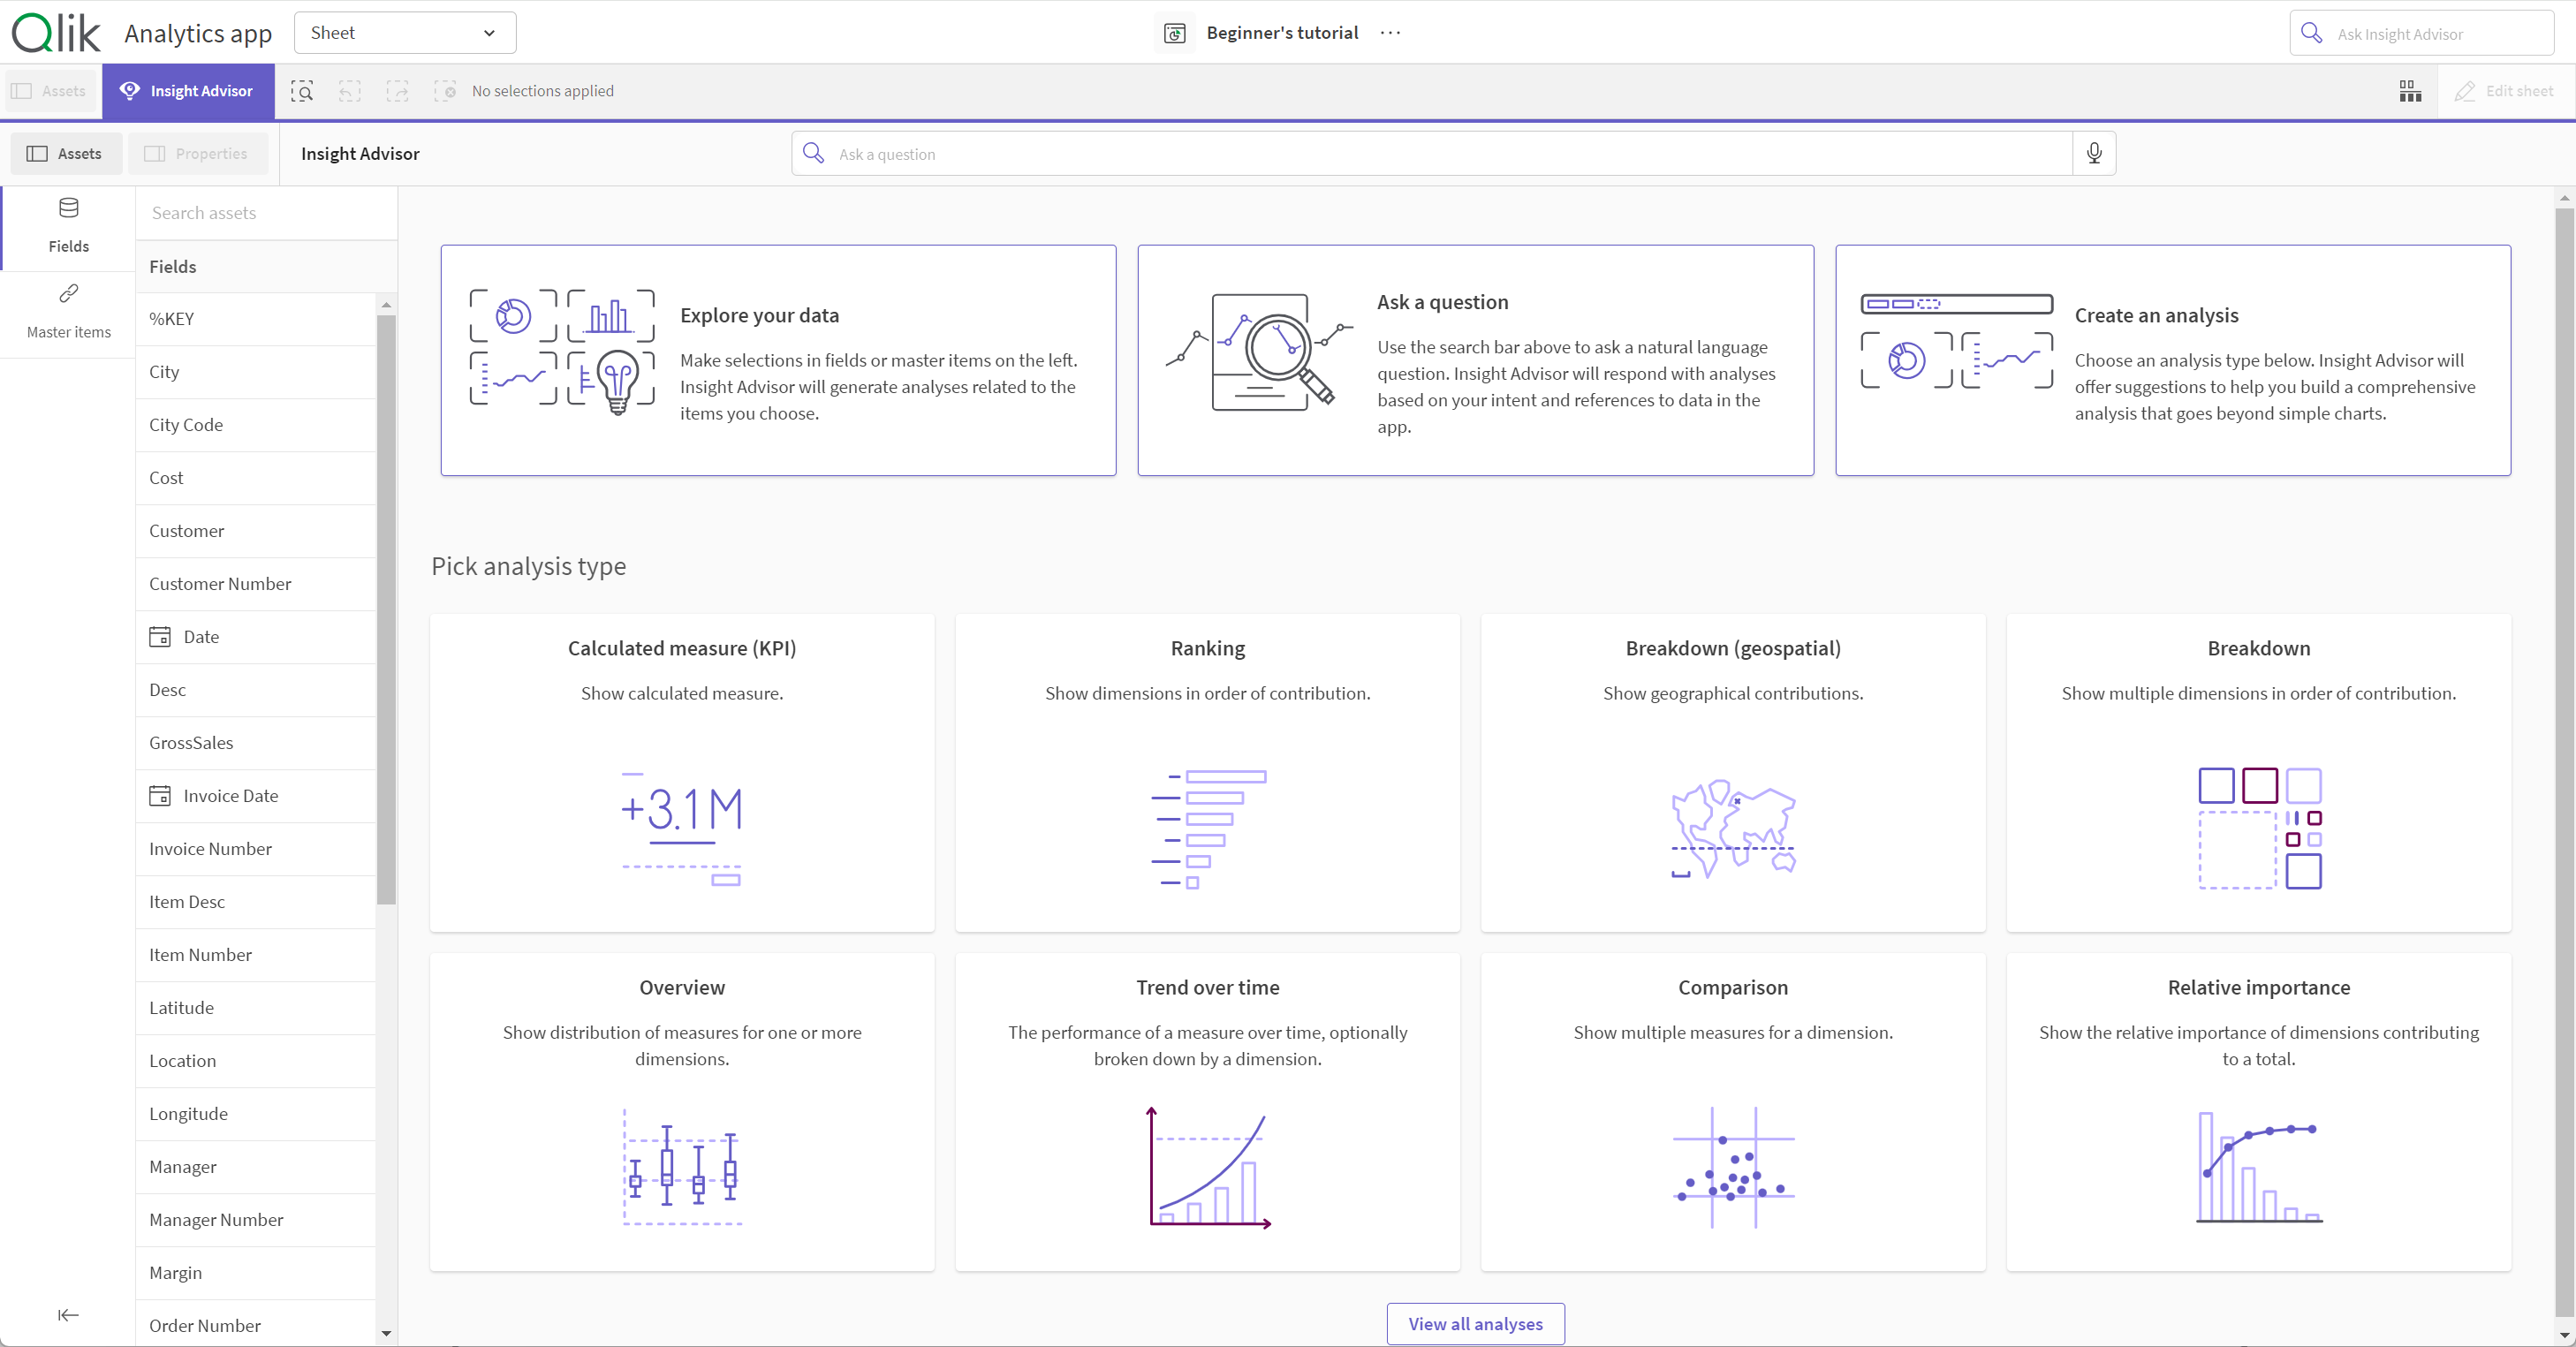
For more information, see [Creating visualizations with Insight Advisor](https://help.qlik.com/en-US/sense/May2025/Subsystems/Hub/Content/Sense_Hub/Insights/insight-advisor-create-visualizations.htm).
## Touch gestures in sheet view
Touch gestures
| Touch gesture | Action |
| --- | --- |
| Long-touch and release | Open the shortcut menu |
| Long-touch a visualization | Open the options menu |
| Swipe | Scroll lists and visualizations |
| Pinch | Zoom in or out on visualizations |
| Two-finger tap | Select an interval in a list, table or bar chart axis |
| Two-finger swipe | Pan a scatter plot visualization |
| Three-finger tap | Reset the zoom level of a scatter plot visualization |
Related learning:
* [Getting started with Qlik Sense](https://help.qlik.com/lnk/Getting_started_QS)
## Learn more
* [Getting started with Qlik Sense](https://help.qlik.com/lnk/Getting_started_QS)