
Density layers
A density layer enables you to visualize the density of points in an area using a color ramp.
Each point influences a circular area, with the highest influence at the center and declining towards its outer perimeter. You can specify the influence radius of the points, change its color and scale it to suit your visualization. Density layers can be used to show hotspots of activity, population densities and more.
Map with density layer displaying number of global volcanic eruptions.

Adding a density layer
Do the following:
-
From Layers in the advanced properties, click Add layer and select Density layer.
-
In Dimensions, click Add and select a field containing point data to use as the dimension.
-
If there are issues with the point locations, adjust the location settings in Locations in the properties panel.
For more information, see Map chart.
-
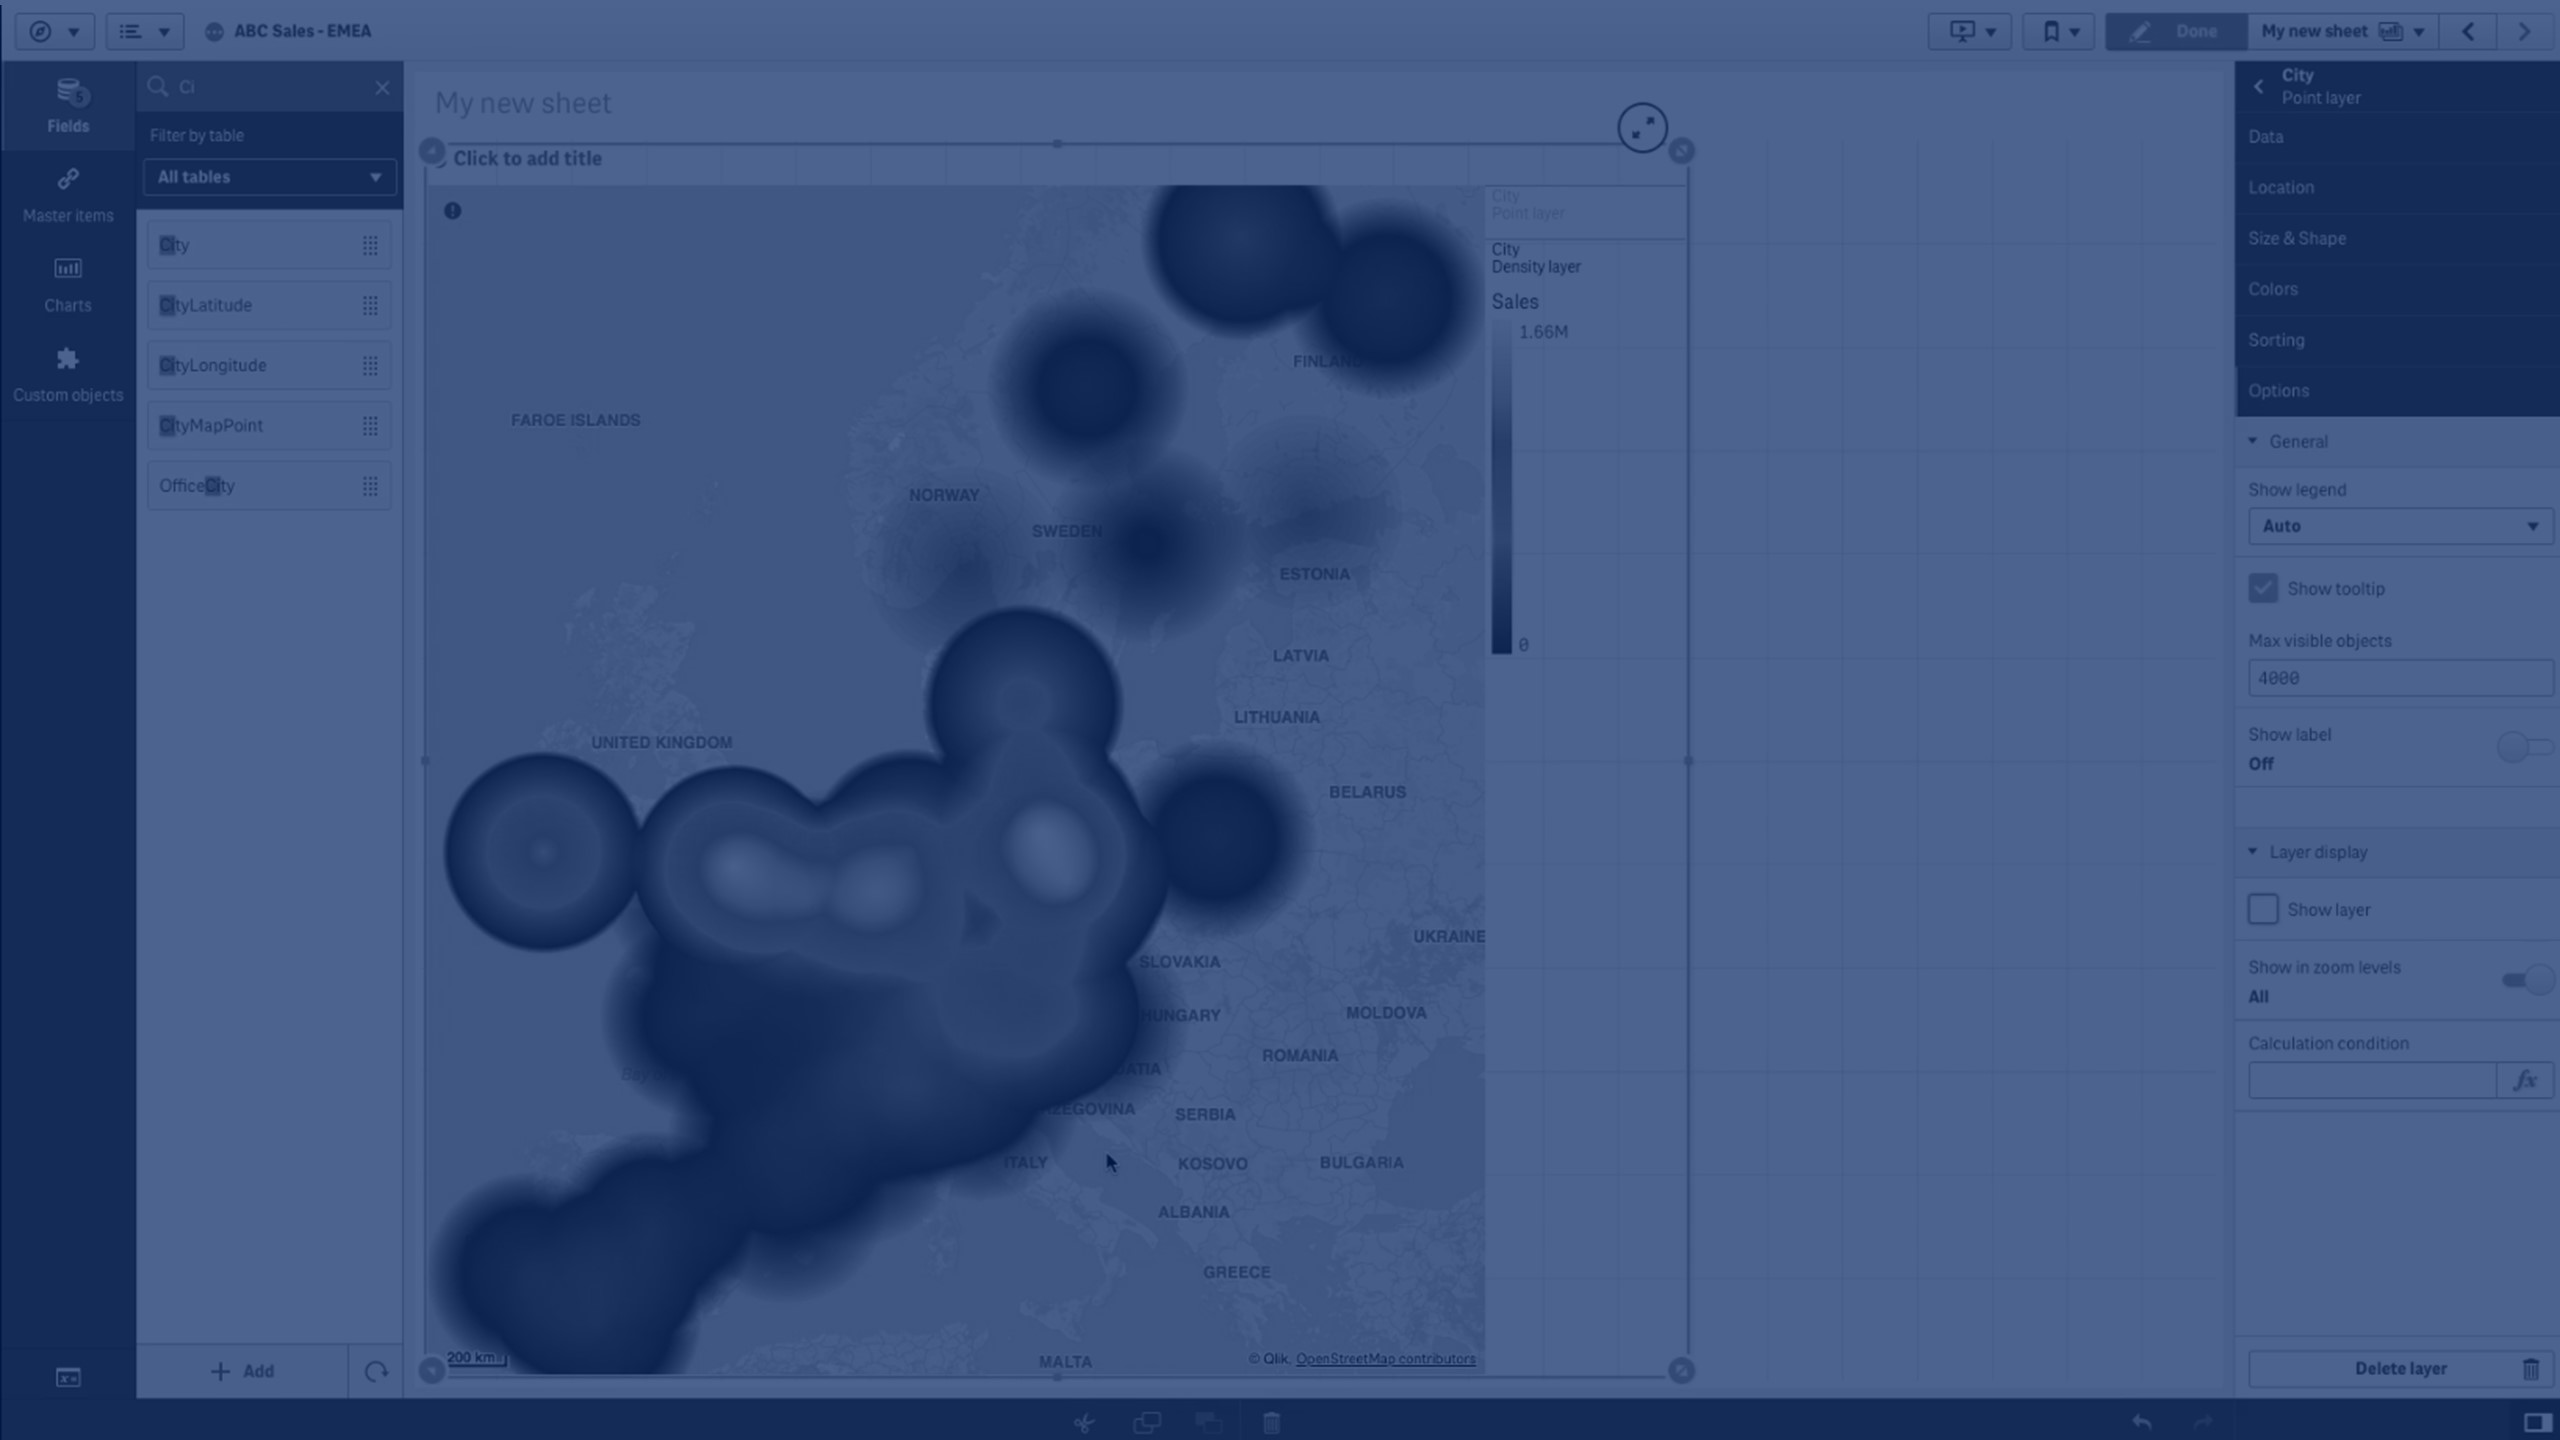
Optionally, in Options > General, after Max visible objects, set the maximum locations to display in the layer.
The maximum number of values in a map layer is 50,000. By default, layers display a maximum of 4,000 values for point layers and 1,000 for other layers.
Once the layer is added, you can adjust settings for the layer in the properties panel. .