
This example shows how to use the relative numbers modifier to calculate contribution in a one dimensional table.
Dataset
In this example, we will use a data file available in the Qlik Sense Tutorial - Building an App. Download and expand the tutorial. The file is available in the Tutorials source folder: Sales.xls
To download the file, go to Tutorial - Building an App.
Add the data file to an empty app. The dataset that is loaded contains sales data.
Measure
We use the sales volume as the measure that we create in Master items:
- Sales with the expression Sum(Sales). This is the sum of the sales volume.
Visualization
We start by adding a filter pane to the sheet and set the following data properties:
- Dimension: Product Group.
We also add a table to the sheet and set the following data properties:
- Dimension: Year (Date.Year).
- Measure: Sales; the measure that was previously created.
The following table is created, with columns showing the year, and the sum of sales for each year.

Make sure to set the Number formatting to Money, and the Format pattern to $ #,##0;-$ #,##0.
It is good practice to have the title of your charts represent their content. Additionally, consider changing with the title of each column to reflect what it represents. The first column that we added is the Year, and the second column contains the Sales per year.
Relative numbers
We could use the filter pane to select specific product groups and see their yearly sales and their total sales. That would not provide a good comparison to their contribution. Instead we will use relative numbers to get percentages as an indication of the product group contribution. By changing the parameters upon which the relative numbers calculation is based, we will get different contributions and gain more insight.
Contribution of a year to the sales of product group
To see how much each year has contributed to the total sales of a specific product group when we make a selection, we need to add a third column:
Do the following:
-
In the properties panel right-click on Sales per year and select Duplicate.
To use this duplicate measure as a relative number we will apply a modifier.
Do the following:
- Under Measure: Sales per year set the Modifier to Relative numbers. This will set the measure to act as a relative number.
- Set the Modifier>Selection scope to Current selection. This sets the modifier to be calculated relative to any selection made.
- The Modifier>Dimensional scope is set to Disregard dimension by default. This sets the modifier to be calculated relative to the total.
- Set the Number formatting to Custom, and the Format pattern to #,##0%.
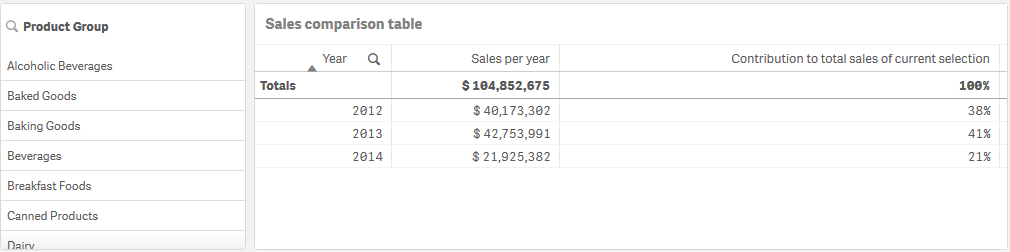
- Change the Label to something meaningful such as Contribution to total sales of current selection.
Our table becomes as follows, with the last column showing the contribution of each year to the total sales of the selected product group.
Contribution of a product group to total sales
To see how much each year's sales of a specific product group have contributed to the total sales of all product groups, we need to add a fourth column:
Do the following:
-
In the properties panel right-click on Contribution to total sales of current selection and select Duplicate.
We will apply the Relative numbers modifier again, but with different properties this time.
Do the following:
- Set the Modifier>Selection scope to Disregard selection. This sets the modifier to be calculated disregarding any selection made.
- The Modifier>Dimensional scope is already set to Disregard dimension. This sets the modifier to be calculated relative to the total.
- Change the Label to something meaningful such as Contribution to total sales from all years.
The Number formatting and the Format pattern are already set, since we duplicated the previous measure.
Our table becomes as follows, with the last column showing the contribution of the selected product group to the total sales from all three years.
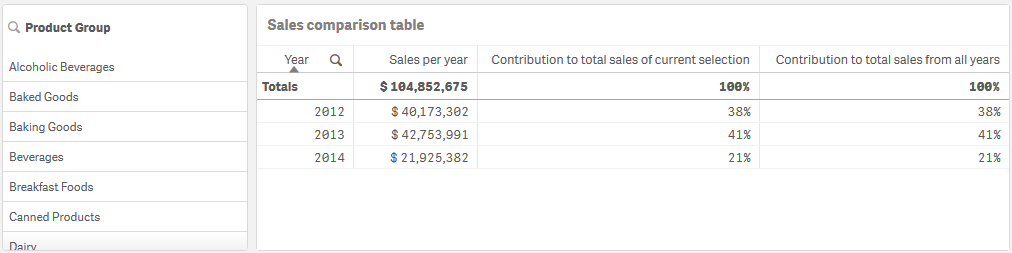
Since we have not made any selections yet, the last two columns have the same values.
Contribution of a product group to yearly sales
To see how much the sales of a specific product group have contributed to that year's sales compared to all the other product groups, we need to add a fifth column:
Do the following:
-
In the properties panel right-click on Contribution to total sales from all years and select Duplicate.
We will apply the Relative numbers modifier again, but with different properties this time.
Do the following:
- Set the Modifier>Selection scope to Disregard selection. This sets the modifier to be calculated disregarding any selection made.
- The Modifier>Dimensional scope is already set to Respect dimension. This sets the modifier to be calculated relative to each dimensional value.
- Change the Label to something meaningful such as Contribution to sales of each year.
Our table becomes as follows, with the last column showing the contribution of the selected product group to the total sales from all three years.
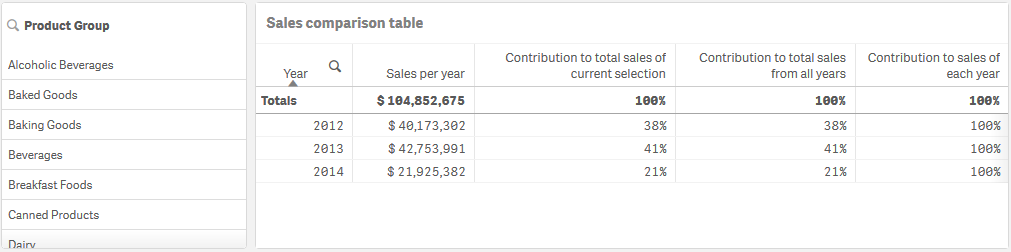
Since we have not made any selections yet, the last column shows the yearly contribution of all product groups for each year.
Making a selection
We can now start making selections to change our relative numbers to something that provides more insight.
Do the following:
- Click
 Done editing in the toolbar.
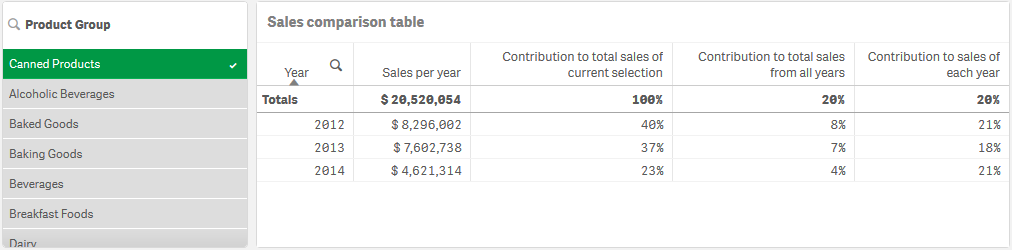
 - Select Canned Products from the product group filter pane.
Our table becomes as follows.
Discovery
The table shows the relative sales for each year. By having the different contribution columns, using the relative numbers as a measure modifier, we get a better understanding of the contribution of each product group to the total sales. From the Contribution to total sales of current selection column we can see that 40% of the Canned Product sales happened in 2012, with a dramatic drop in 2014. The Contribution to total sales from all years column shows that 8% of the total sales from all three years came from the 2012 sales of Canned Product. The Contribution to sales of each year column also tells us that for 2012 the Canned Product sales contributed 21% of the sales of that year, and the same applies to the sales of 2014.