
Maps enable you to view your data geographically.
Maps have many ways to present your data. You can add multiple layers to your map to display different types of information on the same map. You can set a custom scope for locations so that if two locations have the same name, you display the locations and their data correctly. You can use drill-down dimensions to create a hierarchy of geographic areas for selection. You can limit the pan of a map to a specific view and scope of the map, such as a region of interest, out of which users cannot pan or zoom out. You can add custom base maps to your map and use non-WGS-84 coordinates.
When to use maps
You can use a map to show the geographical distribution of offices, stores, and other sites of business interest. You can visualize not only locations but also sales values and other measures and display the value differences by bubble size or color.
Advantages
The map is a versatile visualization that efficiently presents the geographical distribution of key values related to location or area.
Disadvantages
With a large number of values, it may be hard to get a good overview. Values may be placed on top of each other and not visible until zoomed in.
Server connection requirements
In order for a Qlik Sense map chart to be able to perform location lookup and show a background map (base map and layers), your web browser needs to be able to establish a connection with both of the following servers on port 443 (HTTPS):
-
maps.qlikcloud.com (required for location lookups and background map)
-
ibasemaps-api.arcgis.com (required for Satellite base map)
For more information, refer to the Map service connection requirements on Ports used by user web browser.
If you are instead using an on-premise GeoAnalytics server, your map chart will not need access to maps.qlikcloud.com and can function without an internet connection. However, in this setup, the Satellite base map will not be displayed as it requires a connection with ibasemaps-api.arcgis.com. For more information, see Using GeoAnalytics with Qlik Sense map.
Base map
The base map provides the background for the data contained in your layers. You can select your base map in Map settings. Qlik Sense has four default base maps:
- Default: An OpenStreetMap-based map.
- Pale: A paler version of Default.
- Dark: A darker version of Default.
- Satellite: A satellite image map.
- None: No base map.
Additionally, custom base maps can be added using background layers to add your own custom base maps. For example, you could add the floor plan of an airport or office as a custom base map.
Layers
Layers contain visualized dimension and measure data that is displayed over your map. You can stack layers on top of each other. You can also control at what zoom levels different layers appear in or have layers that appear only if other values in a drill-down dimension are selected. This enables you to create different levels of detail as you make selections and zoom in and out of areas of interest on your map. The following layers are available:
-
Point layer: A point layer overlays individual locations on a map, representing them with shapes.
-
Area layer: An area layer presents areas on your map, such as countries or states. With polygon geometry loaded into a field, it can present any custom area.
-
Line layer: A line layer enables you to display lines between points on your map.
-
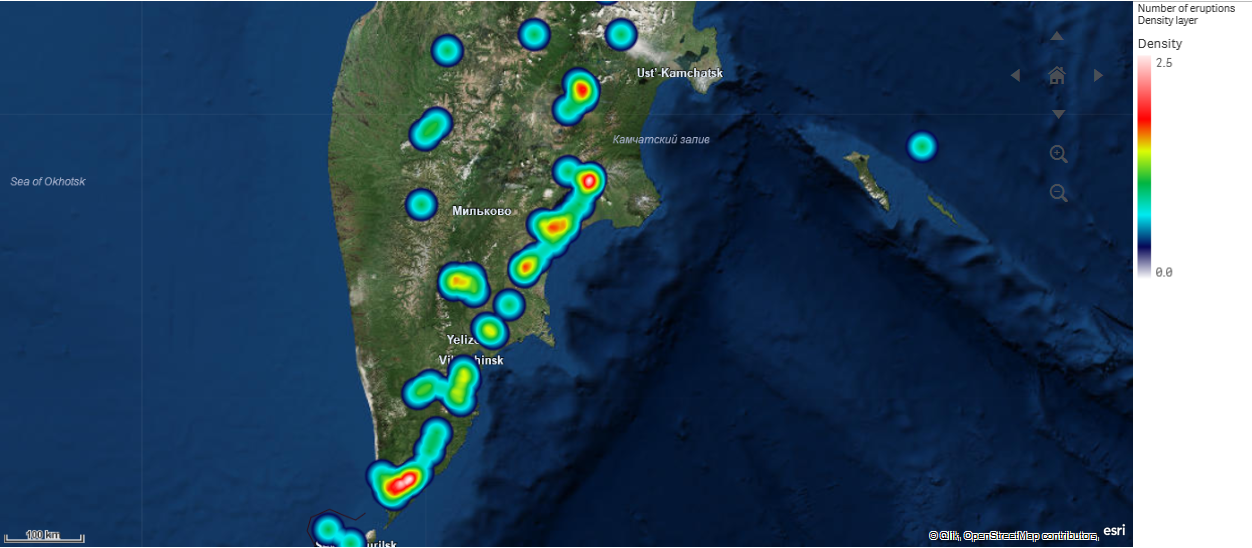
Density layer: A density layer enables you to visualize the density of points in an area using a color ramp.
-
Chart layer: A chart layer enables you to display small pie charts or bar charts over locations in your map.
-
Background layer: Background layers enable you to display a custom base map for your map visualization.
Layers that use drill-down dimensions can be used to create drill-down layers. Drill-down layers enable you to drill-down different hierarchical dimensions in a single layer or in multiple layers. You could, for example, switch between area and point layers as selections are made. For more information, see Drill-down layers. For an example map that uses drill-down dimensions and layers, see Controlling visible map data with drill-down layers.
Location data for map layers
Maps support several ways for determining locations in a layer. You can use the dimension added to the layer. You can alternatively specify fields containing location data for the layer, if the layer dimension does not contain geographic data. In the Location properties, you can specify additional parameters for the location field, such as adding additional fields that include country or administrative area information. For example, if you have a field containing custom area geometries and a field containing the names of the custom areas, you can set the name field as the dimension and then set the area geometry field as the location field in Location in the map properties.
Locations can be either geometries or names of locations such as names of countries, regions, cities, postal codes etc. Layer locations can be defined using fields that contain names and codes. Qlik Sense can identify the following types of locations:
- Continent names
- Country names
- ISO alpha 2 country codes
- ISO alpha 3 country codes
- First-order administrative area names, such as a state or province names
- Second-order administrative area names
- Third-order administrative area names
- Fourth-order administrative area names
- Postal codes or ZIP Codes
- City, village, or other populated place names
- IATA airport codes
- ICAO airport codes
Availability of locations may vary by country. If the named location is not available, use coordinate or area data for the location.
Qlik Sense uses map and location data obtained from recognized field leaders who use accepted methodologies and best practices in marking borders and naming countries within their mappings. Qlik Sense provides flexibility to enable users to integrate their own, separate background maps. If the standard maps do not fit, Qlik Sense offers the option to load customer provided background maps, borders, and areas.
Geometries can either be added at load time by the data preparation service or loaded from geographic sources such as KML. Point layers also support latitudes and longitudes in separate fields. For area layers, areas can be defined using geometries from a geographic data source such as KML files. For more information, see Loading your own map data. Line layers support the same point data as point layers. Line layers also support strings with line geometries in GeoJSONLineString or MultiLineString formats.
If you are using a custom map in a background layer that uses non-WGS-84 coordinates, you can use a field with locations defined in the coordinate system the map uses (either degrees or meters). For more information, see Using non-WGS-84 coordinate systems.
Creating maps
You can add a map to the sheet you are editing.
Do the following:
-
From the assets panel, drag an empty map to the sheet.
-
From Map settings, select the Base map.
-
From Layers in the properties panel, add layers to your map.
Layers are placed above layers of the same type. You can set the order of layers by dragging layers up and down in the list. The layer at the top of your list is also overlaid on top of the other layers on your map.
For information on configuring layers, see:
Once the map is created, you can adjust its appearance and other settings for the map and its layers in the properties panel. For more information on settings, see Map properties.
Limiting location scope in map layers
By default, Qlik Sense searches a broad scope of locations for the location field when names are used. In cases where there are multiple possible matches, you may need to limit the scope of locations searched to ensure Qlik Sense displays the desired location.
Do the following:
- From Layers in the properties panel, click Location.
- Set Scope for location to Custom.
- After Location type, select the type of data contained in the field or expression selected as Location field.
- Optionally, after Country, enter a field, expression, or text indicating the country the locations in the Location field are located.
- Optionally, after Administrative area (Level 1), enter a field, expression, or text indicating the first-level administrative area the locations in the Location field are located.
- Optionally, after Administrative area (Level 2), enter a field, expression, or text indicating the second-level administrative area the locations in the Location field are located.
Limiting panning in your map
You can limit the panning settings in your map to keep the view in your map limited to a set area, such as a specific region of interest. When you limit the panning in a map, you lock the map to the current view. The map will not zoom out further than the current view. You cannot pan the map beyond the limits of the current view. If you zoom in, you can pan, but you are limited by the boundaries of the pan limit.
Do the following:
- From the properties panel, click Appearance.
- In Presentation, set Limit pan navigation to Custom.
- Set your map to the view you want to which you want to limit the pan.
- Click Set pan limit.
You can toggle the set pan limit on and off with Limit pan navigation. You can clear the saved pan limit by clicking Clear pan limit.
Using non-WGS-84 coordinate systems
If you have data and a background map in a projection other than WGS-84, you should set the base map to None, add your background map as a background layer, and then set your projection to use undefined degrees or meters depending on the unit of length used in your base map.
When using non-WGS-84 coordinates, you must use geometries loaded into a field. Location names cannot be used.
Do the following:
- From the properties panel, click Map settings.
- In Base map, select Empty (undefined degrees) or Empty (undefined meters).
-
Select Background layer.
-
After URL, enter the URL to a slippy map server.
For example, http://a.tile.opencyclemap.org/cycle/${z}/${x}/${y}.png .
-
After Attribution, enter the attribution string for the map.
For example, © <a href='http://www.opencyclemap.org/' target='_blank'>OpenCycleMap</a>. Map data © <a href='http://www.openstreetmap.org/copyright' target='_blank'>OpenStreetMap</a> contributors.
- From Layers, click Add layer.
- Select your layer type.
- In Dimensions, click Add and select a field containing data in your map's coordinate system.